Filipino vs Creek Median Household Income
COMPARE
Filipino
Creek
Median Household Income
Median Household Income Comparison
Filipinos
Creek
$115,509
MEDIAN HOUSEHOLD INCOME
100.0/ 100
METRIC RATING
2nd/ 347
METRIC RANK
$67,715
MEDIAN HOUSEHOLD INCOME
0.0/ 100
METRIC RATING
333rd/ 347
METRIC RANK
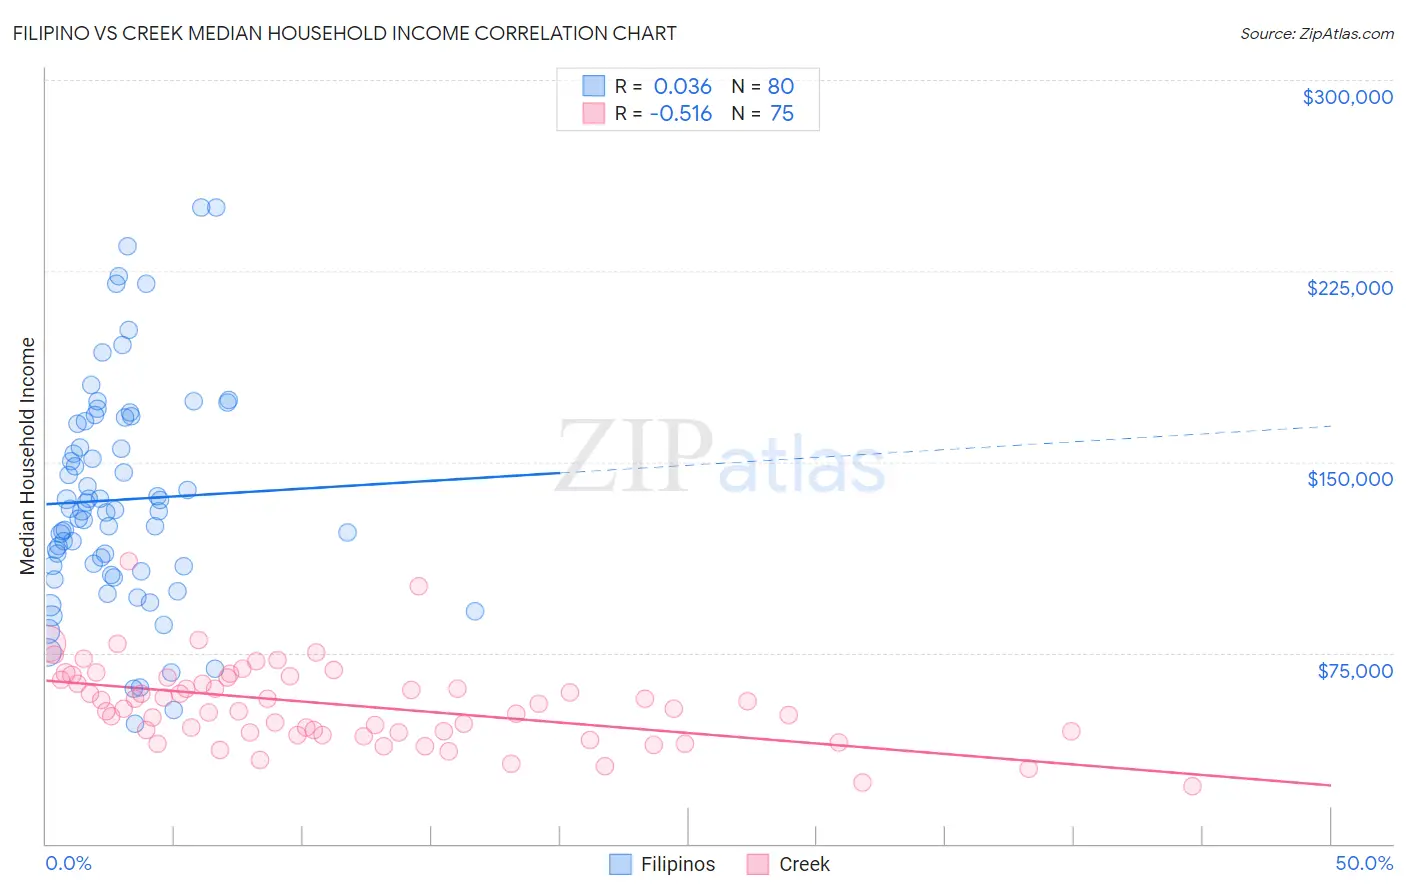
Filipino vs Creek Median Household Income Correlation Chart
The statistical analysis conducted on geographies consisting of 254,115,678 people shows no correlation between the proportion of Filipinos and median household income in the United States with a correlation coefficient (R) of 0.036 and weighted average of $115,509. Similarly, the statistical analysis conducted on geographies consisting of 178,405,677 people shows a substantial negative correlation between the proportion of Creek and median household income in the United States with a correlation coefficient (R) of -0.516 and weighted average of $67,715, a difference of 70.6%.
Median Household Income Correlation Summary
| Measurement | Filipino | Creek |
| Minimum | $47,188 | $22,500 |
| Maximum | $250,001 | $111,063 |
| Range | $202,813 | $88,563 |
| Mean | $135,113 | $54,543 |
| Median | $130,633 | $53,166 |
| Interquartile 25% (IQ1) | $107,886 | $43,621 |
| Interquartile 75% (IQ3) | $165,301 | $65,130 |
| Interquartile Range (IQR) | $57,415 | $21,509 |
| Standard Deviation (Sample) | $43,772 | $15,915 |
| Standard Deviation (Population) | $43,498 | $15,809 |
Similar Demographics by Median Household Income
Demographics Similar to Filipinos by Median Household Income
In terms of median household income, the demographic groups most similar to Filipinos are Immigrants from Taiwan ($116,460, a difference of 0.82%), Immigrants from India ($113,009, a difference of 2.2%), Immigrants from Hong Kong ($111,519, a difference of 3.6%), Thai ($110,648, a difference of 4.4%), and Immigrants from Singapore ($110,428, a difference of 4.6%).
| Demographics | Rating | Rank | Median Household Income |
| Immigrants | Taiwan | 100.0 /100 | #1 | Exceptional $116,460 |
| Filipinos | 100.0 /100 | #2 | Exceptional $115,509 |
| Immigrants | India | 100.0 /100 | #3 | Exceptional $113,009 |
| Immigrants | Hong Kong | 100.0 /100 | #4 | Exceptional $111,519 |
| Thais | 100.0 /100 | #5 | Exceptional $110,648 |
| Immigrants | Singapore | 100.0 /100 | #6 | Exceptional $110,428 |
| Iranians | 100.0 /100 | #7 | Exceptional $109,835 |
| Immigrants | Iran | 100.0 /100 | #8 | Exceptional $108,055 |
| Okinawans | 100.0 /100 | #9 | Exceptional $106,624 |
| Immigrants | South Central Asia | 100.0 /100 | #10 | Exceptional $106,057 |
| Immigrants | China | 100.0 /100 | #11 | Exceptional $105,335 |
| Indians (Asian) | 100.0 /100 | #12 | Exceptional $105,262 |
| Immigrants | Eastern Asia | 100.0 /100 | #13 | Exceptional $104,796 |
| Immigrants | Ireland | 100.0 /100 | #14 | Exceptional $104,692 |
| Immigrants | Israel | 100.0 /100 | #15 | Exceptional $104,090 |
Demographics Similar to Creek by Median Household Income
In terms of median household income, the demographic groups most similar to Creek are Sioux ($67,792, a difference of 0.11%), Black/African American ($67,573, a difference of 0.21%), Native/Alaskan ($67,879, a difference of 0.24%), Arapaho ($67,965, a difference of 0.37%), and Dutch West Indian ($68,412, a difference of 1.0%).
| Demographics | Rating | Rank | Median Household Income |
| Yuman | 0.0 /100 | #326 | Tragic $68,743 |
| Immigrants | Cuba | 0.0 /100 | #327 | Tragic $68,461 |
| Menominee | 0.0 /100 | #328 | Tragic $68,423 |
| Dutch West Indians | 0.0 /100 | #329 | Tragic $68,412 |
| Arapaho | 0.0 /100 | #330 | Tragic $67,965 |
| Natives/Alaskans | 0.0 /100 | #331 | Tragic $67,879 |
| Sioux | 0.0 /100 | #332 | Tragic $67,792 |
| Creek | 0.0 /100 | #333 | Tragic $67,715 |
| Blacks/African Americans | 0.0 /100 | #334 | Tragic $67,573 |
| Cheyenne | 0.0 /100 | #335 | Tragic $66,974 |
| Immigrants | Congo | 0.0 /100 | #336 | Tragic $66,768 |
| Kiowa | 0.0 /100 | #337 | Tragic $65,914 |
| Immigrants | Yemen | 0.0 /100 | #338 | Tragic $65,194 |
| Hopi | 0.0 /100 | #339 | Tragic $65,043 |
| Pueblo | 0.0 /100 | #340 | Tragic $64,692 |