Immigrants from Africa vs Immigrants from Bangladesh Median Male Earnings
COMPARE
Immigrants from Africa
Immigrants from Bangladesh
Median Male Earnings
Median Male Earnings Comparison
Immigrants from Africa
Immigrants from Bangladesh
$53,457
MEDIAN MALE EARNINGS
26.6/ 100
METRIC RATING
196th/ 347
METRIC RANK
$51,642
MEDIAN MALE EARNINGS
5.8/ 100
METRIC RATING
222nd/ 347
METRIC RANK
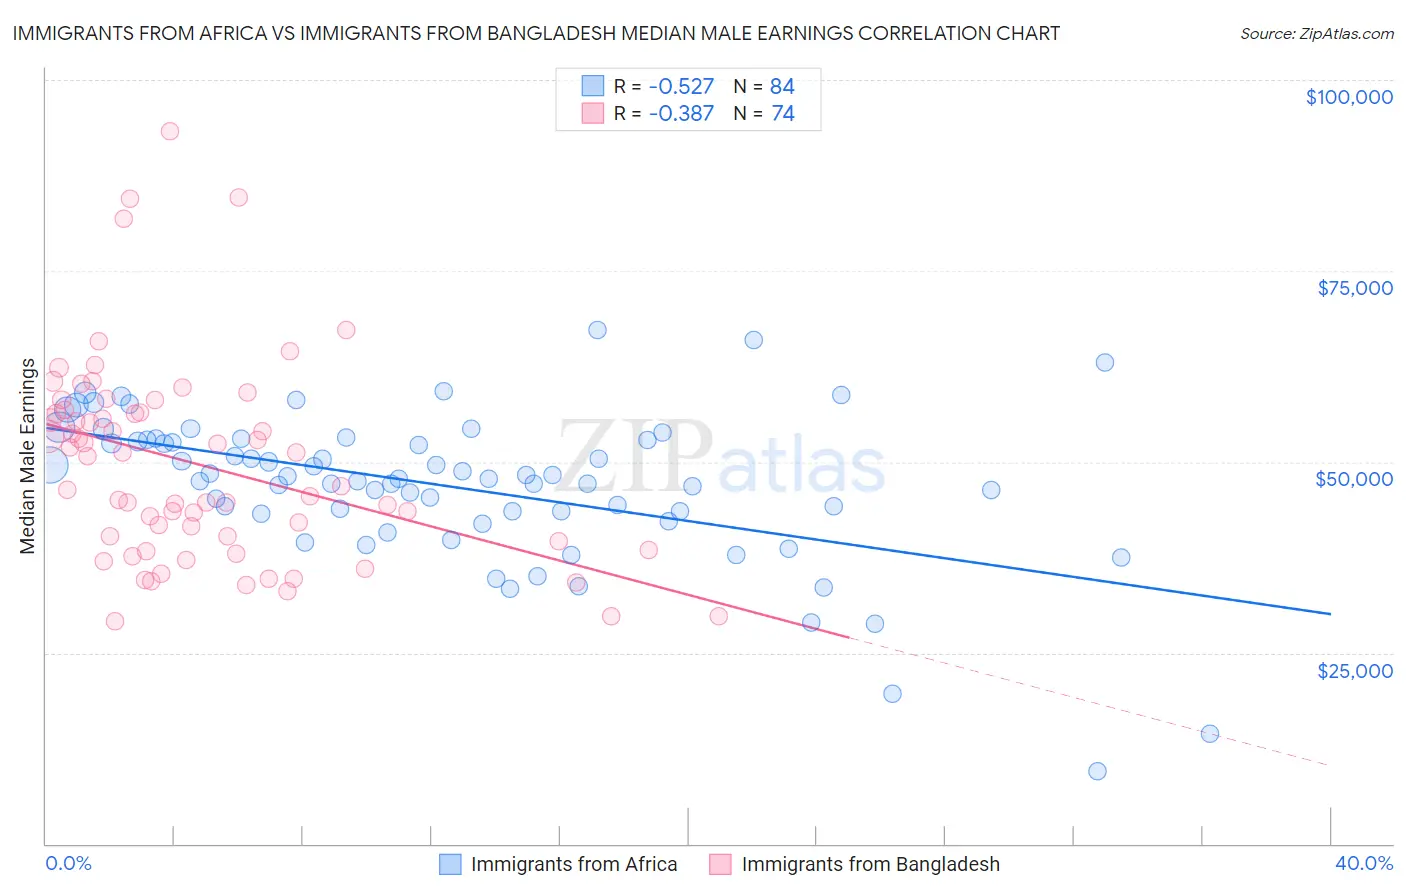
Immigrants from Africa vs Immigrants from Bangladesh Median Male Earnings Correlation Chart
The statistical analysis conducted on geographies consisting of 469,220,260 people shows a substantial negative correlation between the proportion of Immigrants from Africa and median male earnings in the United States with a correlation coefficient (R) of -0.527 and weighted average of $53,457. Similarly, the statistical analysis conducted on geographies consisting of 203,647,380 people shows a mild negative correlation between the proportion of Immigrants from Bangladesh and median male earnings in the United States with a correlation coefficient (R) of -0.387 and weighted average of $51,642, a difference of 3.5%.
Median Male Earnings Correlation Summary
| Measurement | Immigrants from Africa | Immigrants from Bangladesh |
| Minimum | $9,467 | $29,110 |
| Maximum | $67,337 | $93,321 |
| Range | $57,870 | $64,211 |
| Mean | $46,791 | $49,621 |
| Median | $47,827 | $48,826 |
| Interquartile 25% (IQ1) | $43,316 | $39,646 |
| Interquartile 75% (IQ3) | $52,867 | $56,509 |
| Interquartile Range (IQR) | $9,551 | $16,864 |
| Standard Deviation (Sample) | $9,958 | $13,154 |
| Standard Deviation (Population) | $9,899 | $13,064 |
Similar Demographics by Median Male Earnings
Demographics Similar to Immigrants from Africa by Median Male Earnings
In terms of median male earnings, the demographic groups most similar to Immigrants from Africa are Immigrants from Kenya ($53,427, a difference of 0.060%), Immigrants from the Azores ($53,503, a difference of 0.090%), Spanish ($53,576, a difference of 0.22%), Kenyan ($53,647, a difference of 0.36%), and Guamanian/Chamorro ($53,661, a difference of 0.38%).
| Demographics | Rating | Rank | Median Male Earnings |
| Puget Sound Salish | 31.6 /100 | #189 | Fair $53,704 |
| Uruguayans | 31.1 /100 | #190 | Fair $53,680 |
| Guamanians/Chamorros | 30.7 /100 | #191 | Fair $53,661 |
| Scotch-Irish | 30.6 /100 | #192 | Fair $53,658 |
| Kenyans | 30.4 /100 | #193 | Fair $53,647 |
| Spanish | 29.0 /100 | #194 | Fair $53,576 |
| Immigrants | Azores | 27.5 /100 | #195 | Fair $53,503 |
| Immigrants | Africa | 26.6 /100 | #196 | Fair $53,457 |
| Immigrants | Kenya | 26.0 /100 | #197 | Fair $53,427 |
| Immigrants | Costa Rica | 22.6 /100 | #198 | Fair $53,237 |
| Tongans | 22.3 /100 | #199 | Fair $53,218 |
| Immigrants | Thailand | 17.5 /100 | #200 | Poor $52,908 |
| Immigrants | Bosnia and Herzegovina | 16.9 /100 | #201 | Poor $52,869 |
| Immigrants | Uruguay | 16.8 /100 | #202 | Poor $52,860 |
| Panamanians | 16.5 /100 | #203 | Poor $52,835 |
Demographics Similar to Immigrants from Bangladesh by Median Male Earnings
In terms of median male earnings, the demographic groups most similar to Immigrants from Bangladesh are Immigrants from Senegal ($51,647, a difference of 0.010%), Ecuadorian ($51,596, a difference of 0.090%), Immigrants from Cambodia ($51,594, a difference of 0.090%), Immigrants from Armenia ($51,793, a difference of 0.29%), and Immigrants from Sudan ($51,489, a difference of 0.30%).
| Demographics | Rating | Rank | Median Male Earnings |
| Immigrants | Cameroon | 8.9 /100 | #215 | Tragic $52,119 |
| Immigrants | Venezuela | 8.3 /100 | #216 | Tragic $52,041 |
| Nigerians | 8.3 /100 | #217 | Tragic $52,039 |
| Immigrants | Panama | 7.7 /100 | #218 | Tragic $51,962 |
| Immigrants | Ghana | 6.9 /100 | #219 | Tragic $51,836 |
| Immigrants | Armenia | 6.6 /100 | #220 | Tragic $51,793 |
| Immigrants | Senegal | 5.8 /100 | #221 | Tragic $51,647 |
| Immigrants | Bangladesh | 5.8 /100 | #222 | Tragic $51,642 |
| Ecuadorians | 5.5 /100 | #223 | Tragic $51,596 |
| Immigrants | Cambodia | 5.5 /100 | #224 | Tragic $51,594 |
| Immigrants | Sudan | 5.0 /100 | #225 | Tragic $51,489 |
| Japanese | 4.9 /100 | #226 | Tragic $51,473 |
| Trinidadians and Tobagonians | 4.8 /100 | #227 | Tragic $51,446 |
| Samoans | 4.6 /100 | #228 | Tragic $51,389 |
| Immigrants | Trinidad and Tobago | 4.5 /100 | #229 | Tragic $51,376 |