Hungarian vs Mongolian 11th Grade
COMPARE
Hungarian
Mongolian
11th Grade
11th Grade Comparison
Hungarians
Mongolians
94.2%
11TH GRADE
99.9/ 100
METRIC RATING
38th/ 347
METRIC RANK
93.0%
11TH GRADE
87.6/ 100
METRIC RATING
133rd/ 347
METRIC RANK
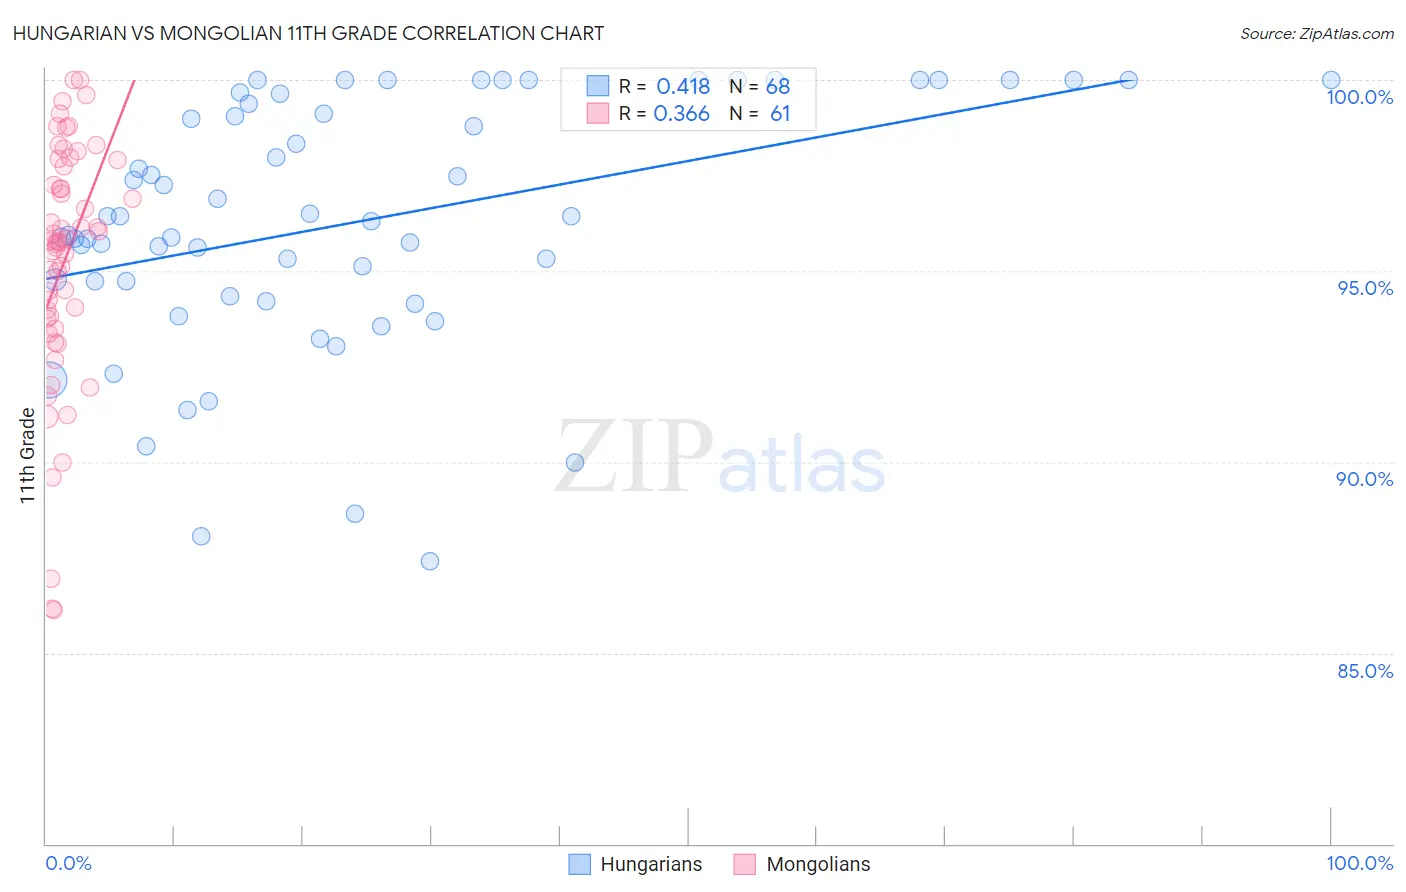
Hungarian vs Mongolian 11th Grade Correlation Chart
The statistical analysis conducted on geographies consisting of 486,240,885 people shows a moderate positive correlation between the proportion of Hungarians and percentage of population with at least 11th grade education in the United States with a correlation coefficient (R) of 0.418 and weighted average of 94.2%. Similarly, the statistical analysis conducted on geographies consisting of 140,362,004 people shows a mild positive correlation between the proportion of Mongolians and percentage of population with at least 11th grade education in the United States with a correlation coefficient (R) of 0.366 and weighted average of 93.0%, a difference of 1.3%.
11th Grade Correlation Summary
| Measurement | Hungarian | Mongolian |
| Minimum | 87.4% | 86.1% |
| Maximum | 100.0% | 100.0% |
| Range | 12.6% | 13.9% |
| Mean | 96.3% | 95.2% |
| Median | 96.4% | 95.8% |
| Interquartile 25% (IQ1) | 94.5% | 93.6% |
| Interquartile 75% (IQ3) | 99.5% | 97.8% |
| Interquartile Range (IQR) | 5.0% | 4.2% |
| Standard Deviation (Sample) | 3.3% | 3.2% |
| Standard Deviation (Population) | 3.2% | 3.2% |
Similar Demographics by 11th Grade
Demographics Similar to Hungarians by 11th Grade
In terms of 11th grade, the demographic groups most similar to Hungarians are Northern European (94.2%, a difference of 0.0%), Immigrants from Singapore (94.2%, a difference of 0.010%), Immigrants from Northern Europe (94.2%, a difference of 0.010%), British (94.2%, a difference of 0.020%), and Immigrants from Scotland (94.2%, a difference of 0.020%).
| Demographics | Rating | Rank | 11th Grade |
| Welsh | 99.9 /100 | #31 | Exceptional 94.2% |
| Belgians | 99.9 /100 | #32 | Exceptional 94.2% |
| British | 99.9 /100 | #33 | Exceptional 94.2% |
| Immigrants | Scotland | 99.9 /100 | #34 | Exceptional 94.2% |
| Immigrants | Singapore | 99.9 /100 | #35 | Exceptional 94.2% |
| Immigrants | Northern Europe | 99.9 /100 | #36 | Exceptional 94.2% |
| Northern Europeans | 99.9 /100 | #37 | Exceptional 94.2% |
| Hungarians | 99.9 /100 | #38 | Exceptional 94.2% |
| Immigrants | Lithuania | 99.9 /100 | #39 | Exceptional 94.1% |
| Thais | 99.9 /100 | #40 | Exceptional 94.1% |
| Cypriots | 99.9 /100 | #41 | Exceptional 94.1% |
| Immigrants | Austria | 99.9 /100 | #42 | Exceptional 94.1% |
| Greeks | 99.9 /100 | #43 | Exceptional 94.1% |
| Immigrants | Ireland | 99.9 /100 | #44 | Exceptional 94.1% |
| Australians | 99.9 /100 | #45 | Exceptional 94.1% |
Demographics Similar to Mongolians by 11th Grade
In terms of 11th grade, the demographic groups most similar to Mongolians are Delaware (93.0%, a difference of 0.010%), Immigrants from Italy (92.9%, a difference of 0.020%), Immigrants from Bosnia and Herzegovina (93.0%, a difference of 0.030%), Cree (92.9%, a difference of 0.030%), and Arab (92.9%, a difference of 0.040%).
| Demographics | Rating | Rank | 11th Grade |
| Basques | 95.2 /100 | #126 | Exceptional 93.2% |
| Immigrants | Kazakhstan | 92.4 /100 | #127 | Exceptional 93.1% |
| Immigrants | Jordan | 92.4 /100 | #128 | Exceptional 93.1% |
| Immigrants | Ukraine | 89.8 /100 | #129 | Excellent 93.0% |
| Albanians | 89.5 /100 | #130 | Excellent 93.0% |
| Egyptians | 89.5 /100 | #131 | Excellent 93.0% |
| Immigrants | Bosnia and Herzegovina | 89.0 /100 | #132 | Excellent 93.0% |
| Mongolians | 87.6 /100 | #133 | Excellent 93.0% |
| Delaware | 87.3 /100 | #134 | Excellent 93.0% |
| Immigrants | Italy | 86.6 /100 | #135 | Excellent 92.9% |
| Cree | 85.9 /100 | #136 | Excellent 92.9% |
| Arabs | 85.4 /100 | #137 | Excellent 92.9% |
| Immigrants | Brazil | 85.1 /100 | #138 | Excellent 92.9% |
| Crow | 84.1 /100 | #139 | Excellent 92.9% |
| Venezuelans | 83.4 /100 | #140 | Excellent 92.9% |