Houma vs Immigrants Householder Income Ages 45 - 64 years
COMPARE
Houma
Immigrants
Householder Income Ages 45 - 64 years
Householder Income Ages 45 - 64 years Comparison
Houma
Immigrants
$72,093
HOUSEHOLDER INCOME AGES 45 - 64 YEARS
0.0/ 100
METRIC RATING
344th/ 347
METRIC RANK
$99,943
HOUSEHOLDER INCOME AGES 45 - 64 YEARS
45.3/ 100
METRIC RATING
181st/ 347
METRIC RANK
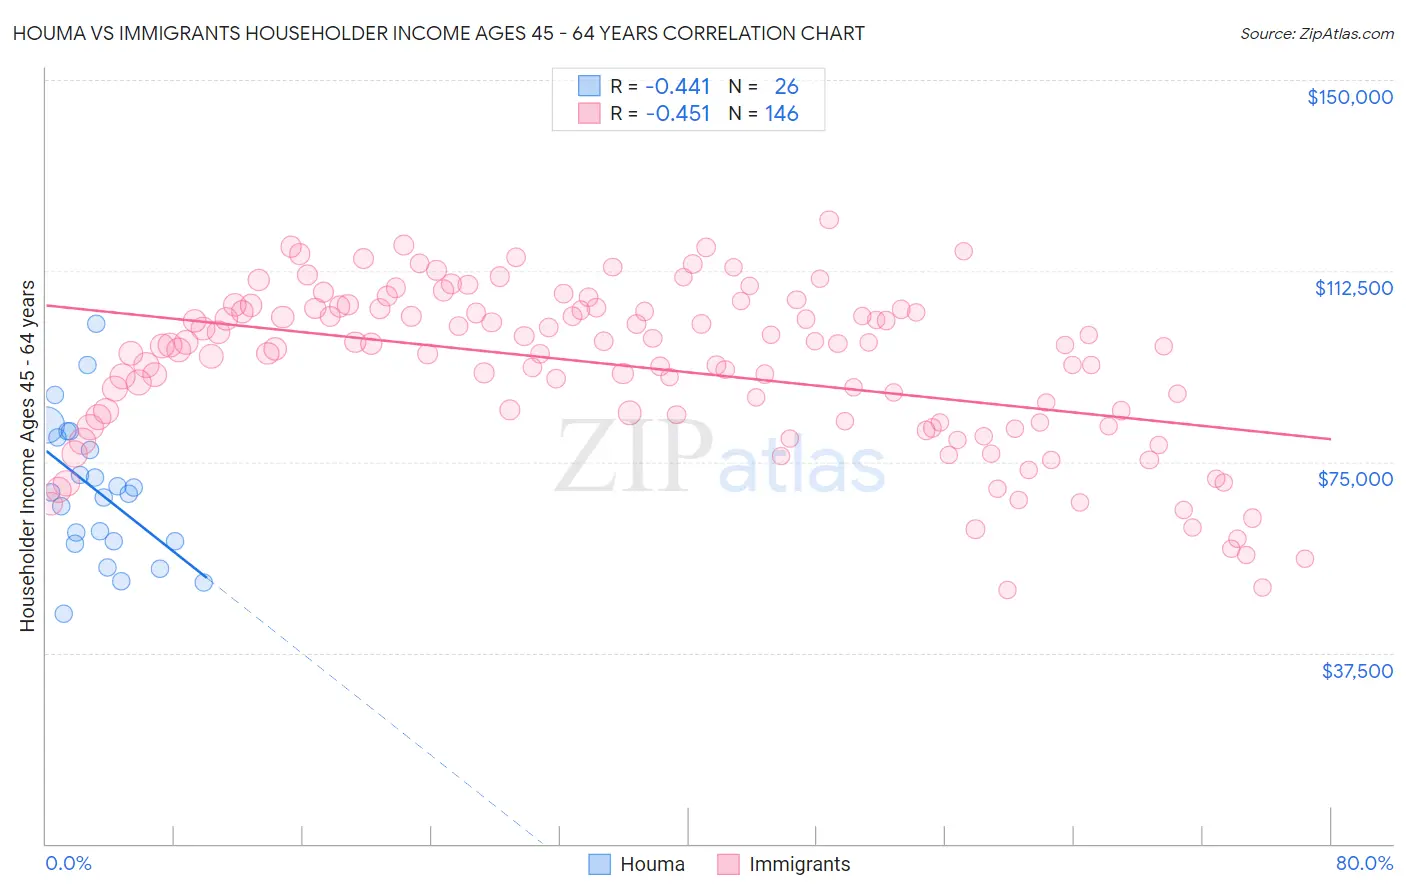
Houma vs Immigrants Householder Income Ages 45 - 64 years Correlation Chart
The statistical analysis conducted on geographies consisting of 36,775,541 people shows a moderate negative correlation between the proportion of Houma and household income with householder between the ages 45 and 64 in the United States with a correlation coefficient (R) of -0.441 and weighted average of $72,093. Similarly, the statistical analysis conducted on geographies consisting of 573,032,532 people shows a moderate negative correlation between the proportion of Immigrants and household income with householder between the ages 45 and 64 in the United States with a correlation coefficient (R) of -0.451 and weighted average of $99,943, a difference of 38.6%.
Householder Income Ages 45 - 64 years Correlation Summary
| Measurement | Houma | Immigrants |
| Minimum | $45,223 | $49,742 |
| Maximum | $102,148 | $122,626 |
| Range | $56,925 | $72,884 |
| Mean | $69,210 | $93,603 |
| Median | $68,942 | $97,670 |
| Interquartile 25% (IQ1) | $59,348 | $82,744 |
| Interquartile 75% (IQ3) | $79,871 | $104,952 |
| Interquartile Range (IQR) | $20,523 | $22,209 |
| Standard Deviation (Sample) | $13,841 | $15,834 |
| Standard Deviation (Population) | $13,573 | $15,779 |
Similar Demographics by Householder Income Ages 45 - 64 years
Demographics Similar to Houma by Householder Income Ages 45 - 64 years
In terms of householder income ages 45 - 64 years, the demographic groups most similar to Houma are Pima ($73,365, a difference of 1.8%), Tohono O'odham ($73,774, a difference of 2.3%), Crow ($74,257, a difference of 3.0%), Navajo ($69,759, a difference of 3.4%), and Immigrants from Yemen ($74,575, a difference of 3.4%).
| Demographics | Rating | Rank | Householder Income Ages 45 - 64 years |
| Immigrants | Congo | 0.0 /100 | #333 | Tragic $77,850 |
| Menominee | 0.0 /100 | #334 | Tragic $76,903 |
| Cheyenne | 0.0 /100 | #335 | Tragic $76,362 |
| Arapaho | 0.0 /100 | #336 | Tragic $75,945 |
| Pueblo | 0.0 /100 | #337 | Tragic $75,601 |
| Hopi | 0.0 /100 | #338 | Tragic $75,562 |
| Kiowa | 0.0 /100 | #339 | Tragic $74,815 |
| Immigrants | Yemen | 0.0 /100 | #340 | Tragic $74,575 |
| Crow | 0.0 /100 | #341 | Tragic $74,257 |
| Tohono O'odham | 0.0 /100 | #342 | Tragic $73,774 |
| Pima | 0.0 /100 | #343 | Tragic $73,365 |
| Houma | 0.0 /100 | #344 | Tragic $72,093 |
| Navajo | 0.0 /100 | #345 | Tragic $69,759 |
| Puerto Ricans | 0.0 /100 | #346 | Tragic $69,234 |
| Lumbee | 0.0 /100 | #347 | Tragic $65,113 |
Demographics Similar to Immigrants by Householder Income Ages 45 - 64 years
In terms of householder income ages 45 - 64 years, the demographic groups most similar to Immigrants are Finnish ($99,904, a difference of 0.040%), Spaniard ($99,889, a difference of 0.050%), Aleut ($100,052, a difference of 0.11%), Belgian ($100,060, a difference of 0.12%), and French ($99,824, a difference of 0.12%).
| Demographics | Rating | Rank | Householder Income Ages 45 - 64 years |
| Welsh | 50.0 /100 | #174 | Average $100,322 |
| Germans | 48.8 /100 | #175 | Average $100,224 |
| Immigrants | Costa Rica | 47.7 /100 | #176 | Average $100,141 |
| Moroccans | 47.7 /100 | #177 | Average $100,138 |
| Immigrants | Cameroon | 47.0 /100 | #178 | Average $100,084 |
| Belgians | 46.7 /100 | #179 | Average $100,060 |
| Aleuts | 46.6 /100 | #180 | Average $100,052 |
| Immigrants | Immigrants | 45.3 /100 | #181 | Average $99,943 |
| Finns | 44.8 /100 | #182 | Average $99,904 |
| Spaniards | 44.6 /100 | #183 | Average $99,889 |
| French | 43.8 /100 | #184 | Average $99,824 |
| Colombians | 43.2 /100 | #185 | Average $99,772 |
| Dutch | 41.7 /100 | #186 | Average $99,650 |
| Iraqis | 38.5 /100 | #187 | Fair $99,387 |
| Immigrants | Portugal | 36.3 /100 | #188 | Fair $99,203 |