Houma vs Tohono O'odham Median Earnings
COMPARE
Houma
Tohono O'odham
Median Earnings
Median Earnings Comparison
Houma
Tohono O'odham
$38,949
MEDIAN EARNINGS
0.0/ 100
METRIC RATING
333rd/ 347
METRIC RANK
$36,349
MEDIAN EARNINGS
0.0/ 100
METRIC RATING
345th/ 347
METRIC RANK
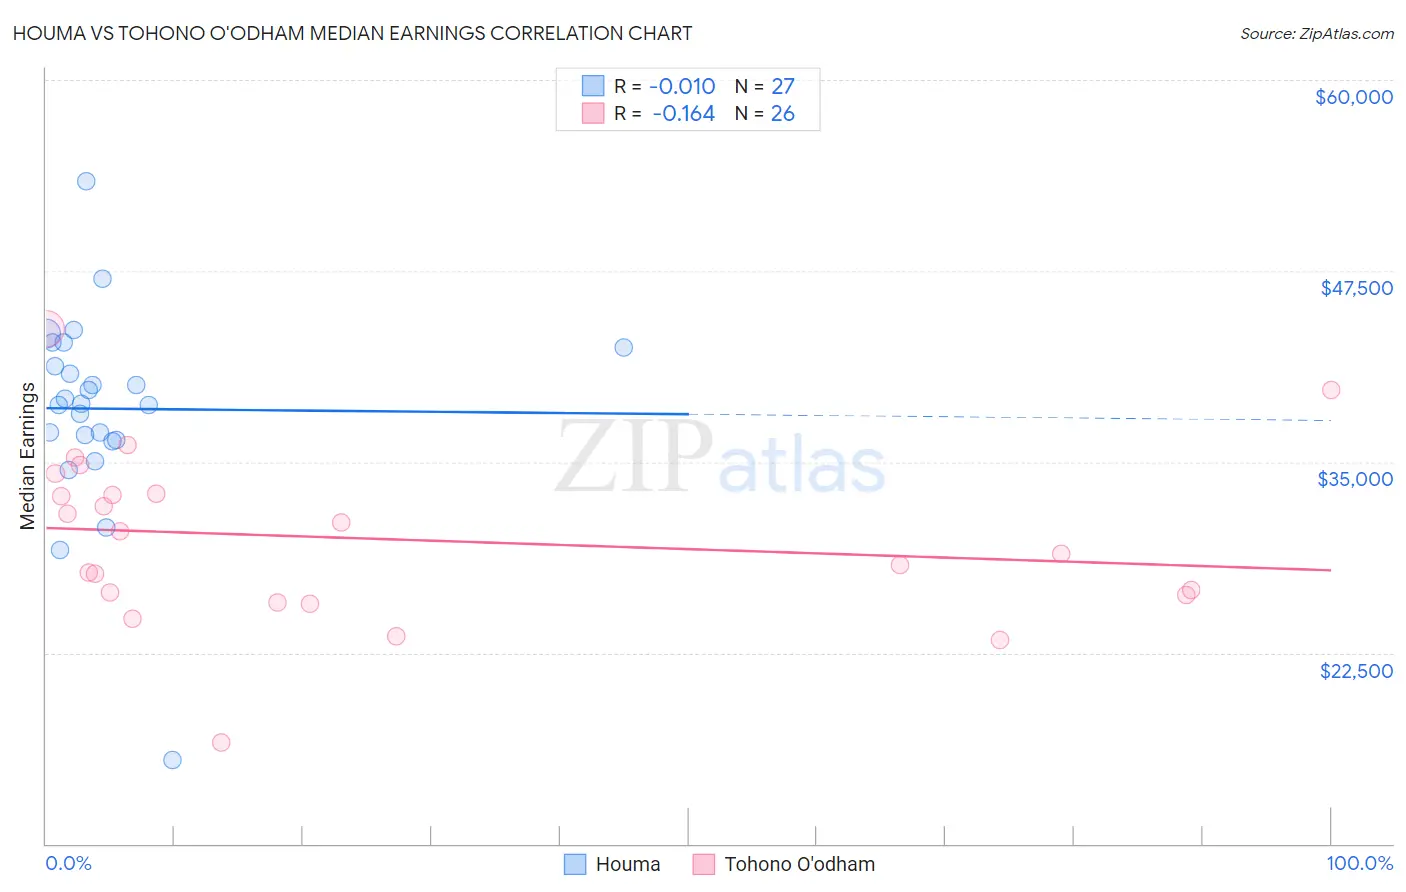
Houma vs Tohono O'odham Median Earnings Correlation Chart
The statistical analysis conducted on geographies consisting of 36,796,366 people shows no correlation between the proportion of Houma and median earnings in the United States with a correlation coefficient (R) of -0.010 and weighted average of $38,949. Similarly, the statistical analysis conducted on geographies consisting of 58,728,293 people shows a poor negative correlation between the proportion of Tohono O'odham and median earnings in the United States with a correlation coefficient (R) of -0.164 and weighted average of $36,349, a difference of 7.1%.
Median Earnings Correlation Summary
| Measurement | Houma | Tohono O'odham |
| Minimum | $15,495 | $16,641 |
| Maximum | $53,358 | $43,705 |
| Range | $37,863 | $27,064 |
| Mean | $38,485 | $29,971 |
| Median | $38,771 | $29,707 |
| Interquartile 25% (IQ1) | $36,392 | $26,250 |
| Interquartile 75% (IQ3) | $42,500 | $32,909 |
| Interquartile Range (IQR) | $6,108 | $6,659 |
| Standard Deviation (Sample) | $6,619 | $5,663 |
| Standard Deviation (Population) | $6,495 | $5,553 |
Demographics Similar to Houma and Tohono O'odham by Median Earnings
In terms of median earnings, the demographic groups most similar to Houma are Spanish American Indian ($38,907, a difference of 0.11%), Native/Alaskan ($38,896, a difference of 0.14%), Yakama ($39,107, a difference of 0.41%), Immigrants from Mexico ($39,114, a difference of 0.42%), and Immigrants from Congo ($39,169, a difference of 0.57%). Similarly, the demographic groups most similar to Tohono O'odham are Arapaho ($36,586, a difference of 0.65%), Yup'ik ($35,942, a difference of 1.1%), Pueblo ($36,859, a difference of 1.4%), Hopi ($36,871, a difference of 1.4%), and Lumbee ($36,876, a difference of 1.5%).
| Demographics | Rating | Rank | Median Earnings |
| Sioux | 0.0 /100 | #328 | Tragic $39,448 |
| Kiowa | 0.0 /100 | #329 | Tragic $39,232 |
| Immigrants | Congo | 0.0 /100 | #330 | Tragic $39,169 |
| Immigrants | Mexico | 0.0 /100 | #331 | Tragic $39,114 |
| Yakama | 0.0 /100 | #332 | Tragic $39,107 |
| Houma | 0.0 /100 | #333 | Tragic $38,949 |
| Spanish American Indians | 0.0 /100 | #334 | Tragic $38,907 |
| Natives/Alaskans | 0.0 /100 | #335 | Tragic $38,896 |
| Crow | 0.0 /100 | #336 | Tragic $38,707 |
| Immigrants | Cuba | 0.0 /100 | #337 | Tragic $38,426 |
| Pima | 0.0 /100 | #338 | Tragic $38,285 |
| Menominee | 0.0 /100 | #339 | Tragic $37,884 |
| Navajo | 0.0 /100 | #340 | Tragic $36,999 |
| Lumbee | 0.0 /100 | #341 | Tragic $36,876 |
| Hopi | 0.0 /100 | #342 | Tragic $36,871 |
| Pueblo | 0.0 /100 | #343 | Tragic $36,859 |
| Arapaho | 0.0 /100 | #344 | Tragic $36,586 |
| Tohono O'odham | 0.0 /100 | #345 | Tragic $36,349 |
| Yup'ik | 0.0 /100 | #346 | Tragic $35,942 |
| Puerto Ricans | 0.0 /100 | #347 | Tragic $35,560 |