Hopi vs Yakama Median Family Income
COMPARE
Hopi
Yakama
Median Family Income
Median Family Income Comparison
Hopi
Yakama
$77,188
MEDIAN FAMILY INCOME
0.0/ 100
METRIC RATING
340th/ 347
METRIC RANK
$83,932
MEDIAN FAMILY INCOME
0.0/ 100
METRIC RATING
317th/ 347
METRIC RANK
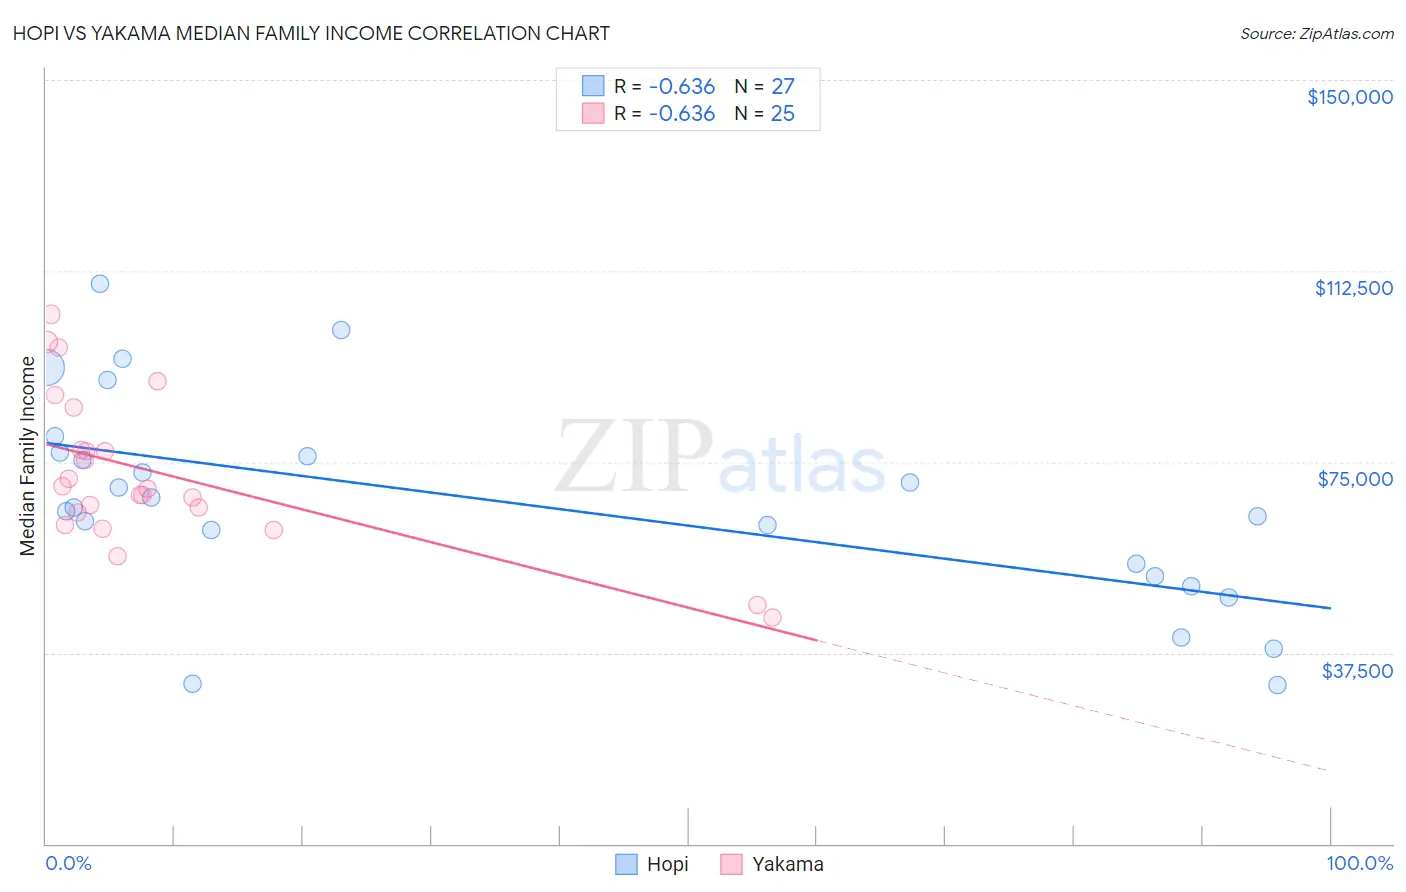
Hopi vs Yakama Median Family Income Correlation Chart
The statistical analysis conducted on geographies consisting of 74,729,125 people shows a significant negative correlation between the proportion of Hopi and median family income in the United States with a correlation coefficient (R) of -0.636 and weighted average of $77,188. Similarly, the statistical analysis conducted on geographies consisting of 19,915,987 people shows a significant negative correlation between the proportion of Yakama and median family income in the United States with a correlation coefficient (R) of -0.636 and weighted average of $83,932, a difference of 8.7%.
Median Family Income Correlation Summary
| Measurement | Hopi | Yakama |
| Minimum | $31,250 | $44,375 |
| Maximum | $109,922 | $103,973 |
| Range | $78,672 | $59,598 |
| Mean | $67,112 | $72,774 |
| Median | $66,093 | $69,699 |
| Interquartile 25% (IQ1) | $52,500 | $63,837 |
| Interquartile 75% (IQ3) | $76,955 | $81,474 |
| Interquartile Range (IQR) | $24,455 | $17,637 |
| Standard Deviation (Sample) | $20,243 | $14,936 |
| Standard Deviation (Population) | $19,865 | $14,634 |
Similar Demographics by Median Family Income
Demographics Similar to Hopi by Median Family Income
In terms of median family income, the demographic groups most similar to Hopi are Pima ($77,431, a difference of 0.32%), Immigrants from Yemen ($77,457, a difference of 0.35%), Pueblo ($76,880, a difference of 0.40%), Crow ($76,605, a difference of 0.76%), and Yuman ($78,055, a difference of 1.1%).
| Demographics | Rating | Rank | Median Family Income |
| Kiowa | 0.0 /100 | #333 | Tragic $80,885 |
| Menominee | 0.0 /100 | #334 | Tragic $79,563 |
| Yup'ik | 0.0 /100 | #335 | Tragic $79,290 |
| Immigrants | Cuba | 0.0 /100 | #336 | Tragic $78,249 |
| Yuman | 0.0 /100 | #337 | Tragic $78,055 |
| Immigrants | Yemen | 0.0 /100 | #338 | Tragic $77,457 |
| Pima | 0.0 /100 | #339 | Tragic $77,431 |
| Hopi | 0.0 /100 | #340 | Tragic $77,188 |
| Pueblo | 0.0 /100 | #341 | Tragic $76,880 |
| Crow | 0.0 /100 | #342 | Tragic $76,605 |
| Houma | 0.0 /100 | #343 | Tragic $76,188 |
| Tohono O'odham | 0.0 /100 | #344 | Tragic $72,193 |
| Navajo | 0.0 /100 | #345 | Tragic $70,989 |
| Puerto Ricans | 0.0 /100 | #346 | Tragic $70,423 |
| Lumbee | 0.0 /100 | #347 | Tragic $68,679 |
Demographics Similar to Yakama by Median Family Income
In terms of median family income, the demographic groups most similar to Yakama are Immigrants from Haiti ($84,018, a difference of 0.10%), Immigrants from Mexico ($83,639, a difference of 0.35%), Immigrants from Honduras ($83,618, a difference of 0.38%), Apache ($84,451, a difference of 0.62%), and Seminole ($83,354, a difference of 0.69%).
| Demographics | Rating | Rank | Median Family Income |
| Immigrants | Central America | 0.0 /100 | #310 | Tragic $85,050 |
| Hondurans | 0.0 /100 | #311 | Tragic $85,004 |
| Cubans | 0.0 /100 | #312 | Tragic $84,981 |
| Choctaw | 0.0 /100 | #313 | Tragic $84,835 |
| Immigrants | Bahamas | 0.0 /100 | #314 | Tragic $84,732 |
| Apache | 0.0 /100 | #315 | Tragic $84,451 |
| Immigrants | Haiti | 0.0 /100 | #316 | Tragic $84,018 |
| Yakama | 0.0 /100 | #317 | Tragic $83,932 |
| Immigrants | Mexico | 0.0 /100 | #318 | Tragic $83,639 |
| Immigrants | Honduras | 0.0 /100 | #319 | Tragic $83,618 |
| Seminole | 0.0 /100 | #320 | Tragic $83,354 |
| Immigrants | Caribbean | 0.0 /100 | #321 | Tragic $83,319 |
| Dominicans | 0.0 /100 | #322 | Tragic $82,888 |
| Bahamians | 0.0 /100 | #323 | Tragic $82,631 |
| Creek | 0.0 /100 | #324 | Tragic $82,560 |