Immigrants from Uzbekistan vs Yakama Median Family Income
COMPARE
Immigrants from Uzbekistan
Yakama
Median Family Income
Median Family Income Comparison
Immigrants from Uzbekistan
Yakama
$103,197
MEDIAN FAMILY INCOME
56.6/ 100
METRIC RATING
170th/ 347
METRIC RANK
$83,932
MEDIAN FAMILY INCOME
0.0/ 100
METRIC RATING
317th/ 347
METRIC RANK
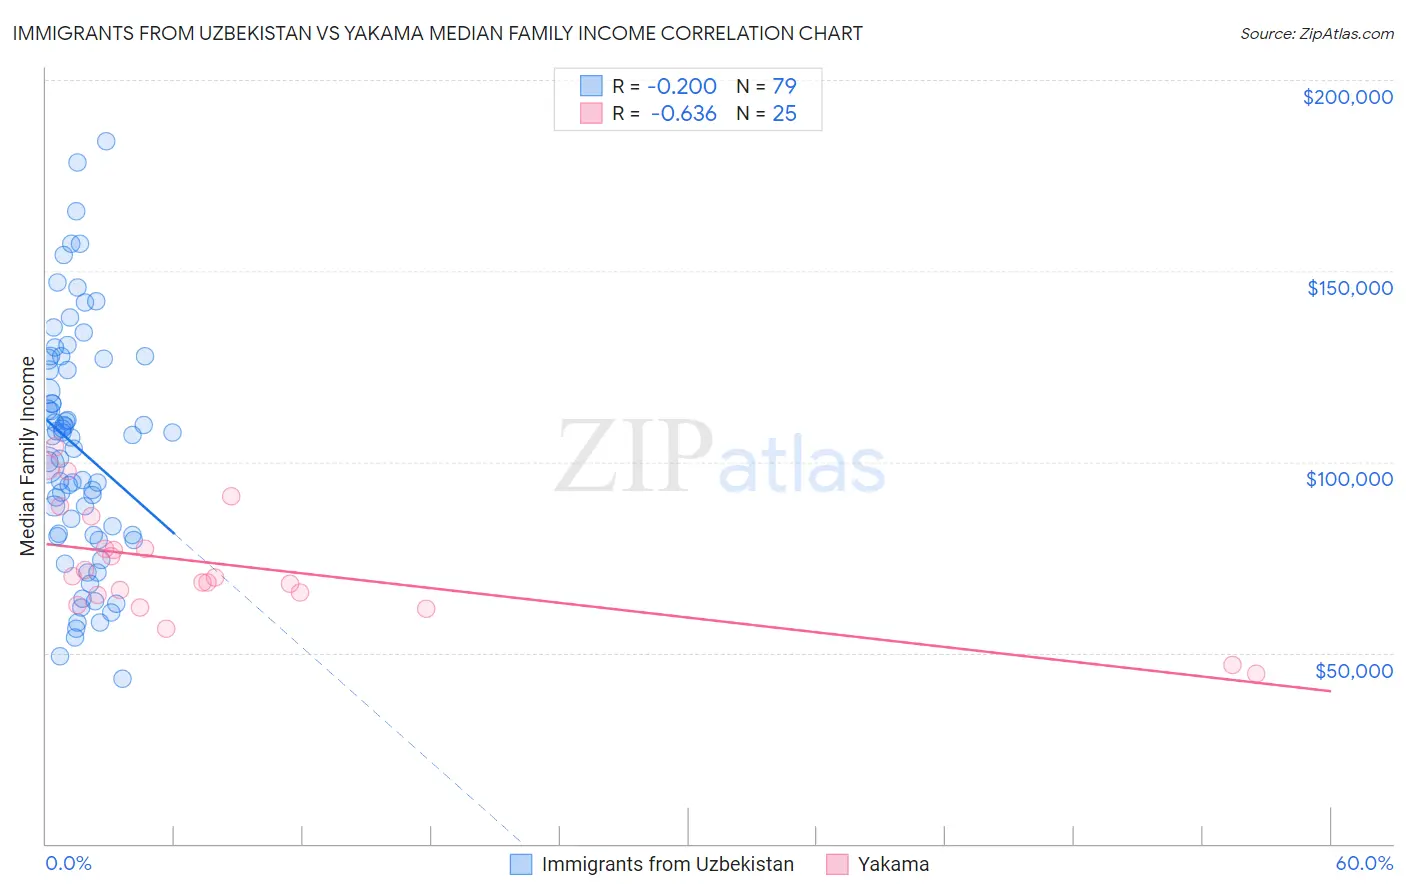
Immigrants from Uzbekistan vs Yakama Median Family Income Correlation Chart
The statistical analysis conducted on geographies consisting of 118,698,354 people shows a poor negative correlation between the proportion of Immigrants from Uzbekistan and median family income in the United States with a correlation coefficient (R) of -0.200 and weighted average of $103,197. Similarly, the statistical analysis conducted on geographies consisting of 19,915,987 people shows a significant negative correlation between the proportion of Yakama and median family income in the United States with a correlation coefficient (R) of -0.636 and weighted average of $83,932, a difference of 23.0%.
Median Family Income Correlation Summary
| Measurement | Immigrants from Uzbekistan | Yakama |
| Minimum | $43,333 | $44,375 |
| Maximum | $184,083 | $103,973 |
| Range | $140,750 | $59,598 |
| Mean | $103,479 | $72,774 |
| Median | $106,438 | $69,699 |
| Interquartile 25% (IQ1) | $80,707 | $63,837 |
| Interquartile 75% (IQ3) | $126,877 | $81,474 |
| Interquartile Range (IQR) | $46,170 | $17,637 |
| Standard Deviation (Sample) | $30,925 | $14,936 |
| Standard Deviation (Population) | $30,729 | $14,634 |
Similar Demographics by Median Family Income
Demographics Similar to Immigrants from Uzbekistan by Median Family Income
In terms of median family income, the demographic groups most similar to Immigrants from Uzbekistan are Czechoslovakian ($103,273, a difference of 0.070%), Alsatian ($103,010, a difference of 0.18%), Immigrants from Peru ($103,534, a difference of 0.33%), Immigrants from Eritrea ($102,823, a difference of 0.36%), and Belgian ($102,788, a difference of 0.40%).
| Demographics | Rating | Rank | Median Family Income |
| Costa Ricans | 66.2 /100 | #163 | Good $103,989 |
| Sierra Leoneans | 64.7 /100 | #164 | Good $103,859 |
| Slovaks | 63.1 /100 | #165 | Good $103,729 |
| English | 62.6 /100 | #166 | Good $103,684 |
| South American Indians | 61.9 /100 | #167 | Good $103,624 |
| Immigrants | Peru | 60.8 /100 | #168 | Good $103,534 |
| Czechoslovakians | 57.6 /100 | #169 | Average $103,273 |
| Immigrants | Uzbekistan | 56.6 /100 | #170 | Average $103,197 |
| Alsatians | 54.3 /100 | #171 | Average $103,010 |
| Immigrants | Eritrea | 51.9 /100 | #172 | Average $102,823 |
| Belgians | 51.4 /100 | #173 | Average $102,788 |
| Finns | 50.0 /100 | #174 | Average $102,676 |
| Immigrants | Eastern Africa | 47.1 /100 | #175 | Average $102,451 |
| French | 46.1 /100 | #176 | Average $102,368 |
| Germans | 44.6 /100 | #177 | Average $102,254 |
Demographics Similar to Yakama by Median Family Income
In terms of median family income, the demographic groups most similar to Yakama are Immigrants from Haiti ($84,018, a difference of 0.10%), Immigrants from Mexico ($83,639, a difference of 0.35%), Immigrants from Honduras ($83,618, a difference of 0.38%), Apache ($84,451, a difference of 0.62%), and Seminole ($83,354, a difference of 0.69%).
| Demographics | Rating | Rank | Median Family Income |
| Immigrants | Central America | 0.0 /100 | #310 | Tragic $85,050 |
| Hondurans | 0.0 /100 | #311 | Tragic $85,004 |
| Cubans | 0.0 /100 | #312 | Tragic $84,981 |
| Choctaw | 0.0 /100 | #313 | Tragic $84,835 |
| Immigrants | Bahamas | 0.0 /100 | #314 | Tragic $84,732 |
| Apache | 0.0 /100 | #315 | Tragic $84,451 |
| Immigrants | Haiti | 0.0 /100 | #316 | Tragic $84,018 |
| Yakama | 0.0 /100 | #317 | Tragic $83,932 |
| Immigrants | Mexico | 0.0 /100 | #318 | Tragic $83,639 |
| Immigrants | Honduras | 0.0 /100 | #319 | Tragic $83,618 |
| Seminole | 0.0 /100 | #320 | Tragic $83,354 |
| Immigrants | Caribbean | 0.0 /100 | #321 | Tragic $83,319 |
| Dominicans | 0.0 /100 | #322 | Tragic $82,888 |
| Bahamians | 0.0 /100 | #323 | Tragic $82,631 |
| Creek | 0.0 /100 | #324 | Tragic $82,560 |