Hopi vs Yakama College, Under 1 year
COMPARE
Hopi
Yakama
College, Under 1 year
College, Under 1 year Comparison
Hopi
Yakama
57.1%
COLLEGE, UNDER 1 YEAR
0.0/ 100
METRIC RATING
314th/ 347
METRIC RANK
52.6%
COLLEGE, UNDER 1 YEAR
0.0/ 100
METRIC RATING
344th/ 347
METRIC RANK
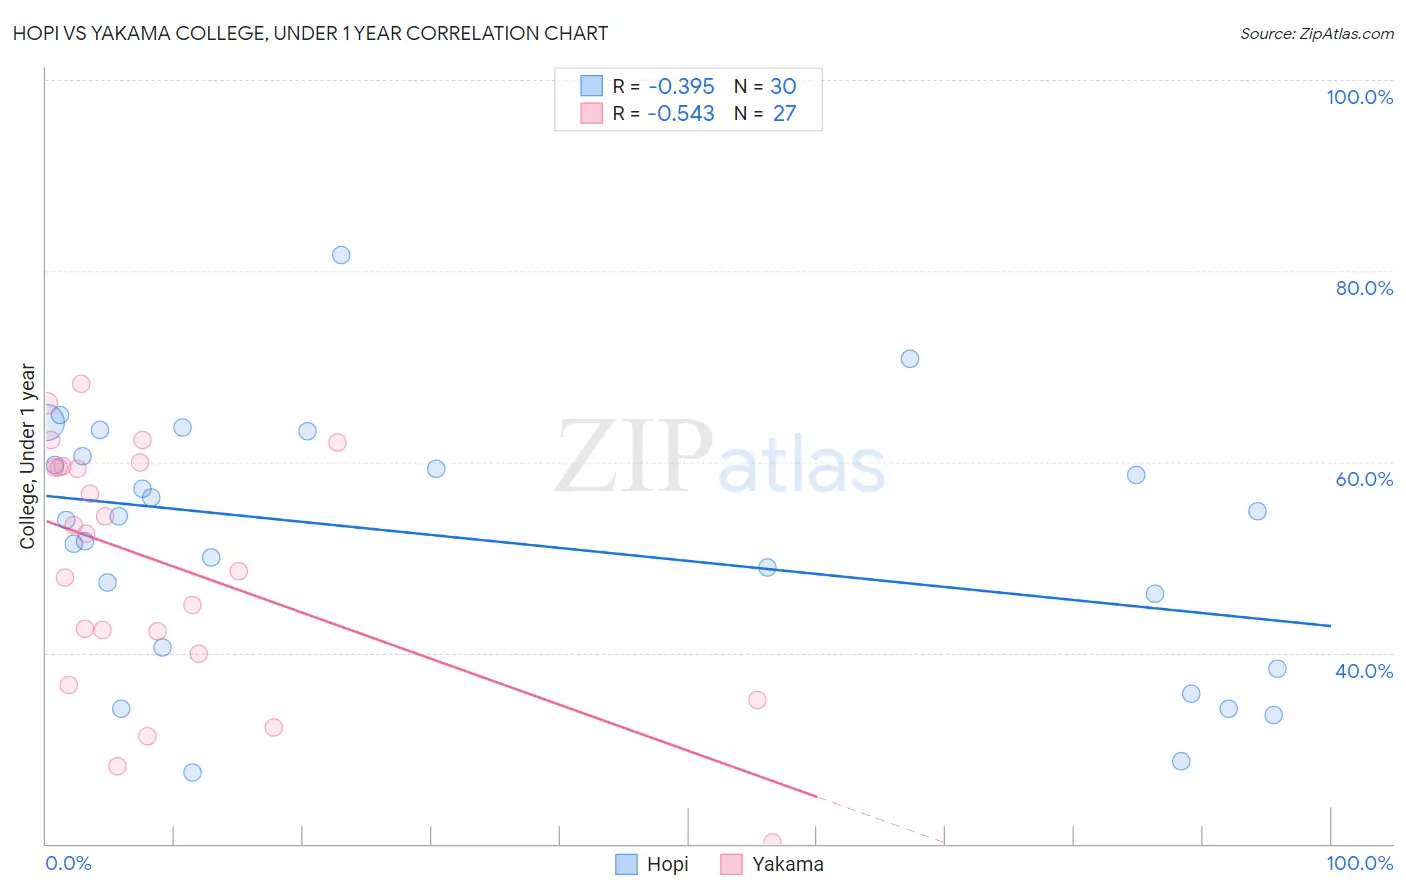
Hopi vs Yakama College, Under 1 year Correlation Chart
The statistical analysis conducted on geographies consisting of 74,740,168 people shows a mild negative correlation between the proportion of Hopi and percentage of population with at least college, under 1 year education in the United States with a correlation coefficient (R) of -0.395 and weighted average of 57.1%. Similarly, the statistical analysis conducted on geographies consisting of 19,923,144 people shows a substantial negative correlation between the proportion of Yakama and percentage of population with at least college, under 1 year education in the United States with a correlation coefficient (R) of -0.543 and weighted average of 52.6%, a difference of 8.5%.
College, Under 1 year Correlation Summary
| Measurement | Hopi | Yakama |
| Minimum | 27.5% | 20.2% |
| Maximum | 81.7% | 68.2% |
| Range | 54.2% | 48.1% |
| Mean | 51.8% | 49.2% |
| Median | 54.1% | 52.5% |
| Interquartile 25% (IQ1) | 40.5% | 40.0% |
| Interquartile 75% (IQ3) | 60.6% | 59.5% |
| Interquartile Range (IQR) | 20.0% | 19.6% |
| Standard Deviation (Sample) | 13.1% | 12.8% |
| Standard Deviation (Population) | 12.9% | 12.6% |
Similar Demographics by College, Under 1 year
Demographics Similar to Hopi by College, Under 1 year
In terms of college, under 1 year, the demographic groups most similar to Hopi are Honduran (57.1%, a difference of 0.040%), Menominee (57.0%, a difference of 0.10%), Dutch West Indian (57.2%, a difference of 0.12%), Hispanic or Latino (57.0%, a difference of 0.14%), and Immigrants from Haiti (56.9%, a difference of 0.25%).
| Demographics | Rating | Rank | College, Under 1 year |
| Fijians | 0.0 /100 | #307 | Tragic 57.7% |
| Central Americans | 0.0 /100 | #308 | Tragic 57.7% |
| Immigrants | Nicaragua | 0.0 /100 | #309 | Tragic 57.6% |
| Pueblo | 0.0 /100 | #310 | Tragic 57.4% |
| Cajuns | 0.0 /100 | #311 | Tragic 57.3% |
| Salvadorans | 0.0 /100 | #312 | Tragic 57.3% |
| Dutch West Indians | 0.0 /100 | #313 | Tragic 57.2% |
| Hopi | 0.0 /100 | #314 | Tragic 57.1% |
| Hondurans | 0.0 /100 | #315 | Tragic 57.1% |
| Menominee | 0.0 /100 | #316 | Tragic 57.0% |
| Hispanics or Latinos | 0.0 /100 | #317 | Tragic 57.0% |
| Immigrants | Haiti | 0.0 /100 | #318 | Tragic 56.9% |
| Puerto Ricans | 0.0 /100 | #319 | Tragic 56.8% |
| Guatemalans | 0.0 /100 | #320 | Tragic 56.8% |
| Natives/Alaskans | 0.0 /100 | #321 | Tragic 56.6% |
Demographics Similar to Yakama by College, Under 1 year
In terms of college, under 1 year, the demographic groups most similar to Yakama are Tohono O'odham (52.8%, a difference of 0.30%), Immigrants from Mexico (53.7%, a difference of 1.9%), Immigrants from Cabo Verde (53.7%, a difference of 2.0%), Pima (51.4%, a difference of 2.4%), and Spanish American Indian (54.0%, a difference of 2.5%).
| Demographics | Rating | Rank | College, Under 1 year |
| Yuman | 0.0 /100 | #333 | Tragic 55.1% |
| Immigrants | Azores | 0.0 /100 | #334 | Tragic 54.7% |
| Inupiat | 0.0 /100 | #335 | Tragic 54.6% |
| Pennsylvania Germans | 0.0 /100 | #336 | Tragic 54.5% |
| Immigrants | Central America | 0.0 /100 | #337 | Tragic 54.4% |
| Lumbee | 0.0 /100 | #338 | Tragic 54.2% |
| Immigrants | Dominican Republic | 0.0 /100 | #339 | Tragic 54.0% |
| Spanish American Indians | 0.0 /100 | #340 | Tragic 54.0% |
| Immigrants | Cabo Verde | 0.0 /100 | #341 | Tragic 53.7% |
| Immigrants | Mexico | 0.0 /100 | #342 | Tragic 53.7% |
| Tohono O'odham | 0.0 /100 | #343 | Tragic 52.8% |
| Yakama | 0.0 /100 | #344 | Tragic 52.6% |
| Pima | 0.0 /100 | #345 | Tragic 51.4% |
| Houma | 0.0 /100 | #346 | Tragic 47.6% |
| Yup'ik | 0.0 /100 | #347 | Tragic 45.8% |