Hopi vs Pennsylvania German Median Male Earnings
COMPARE
Hopi
Pennsylvania German
Median Male Earnings
Median Male Earnings Comparison
Hopi
Pennsylvania Germans
$42,060
MEDIAN MALE EARNINGS
0.0/ 100
METRIC RATING
341st/ 347
METRIC RANK
$50,878
MEDIAN MALE EARNINGS
2.8/ 100
METRIC RATING
236th/ 347
METRIC RANK
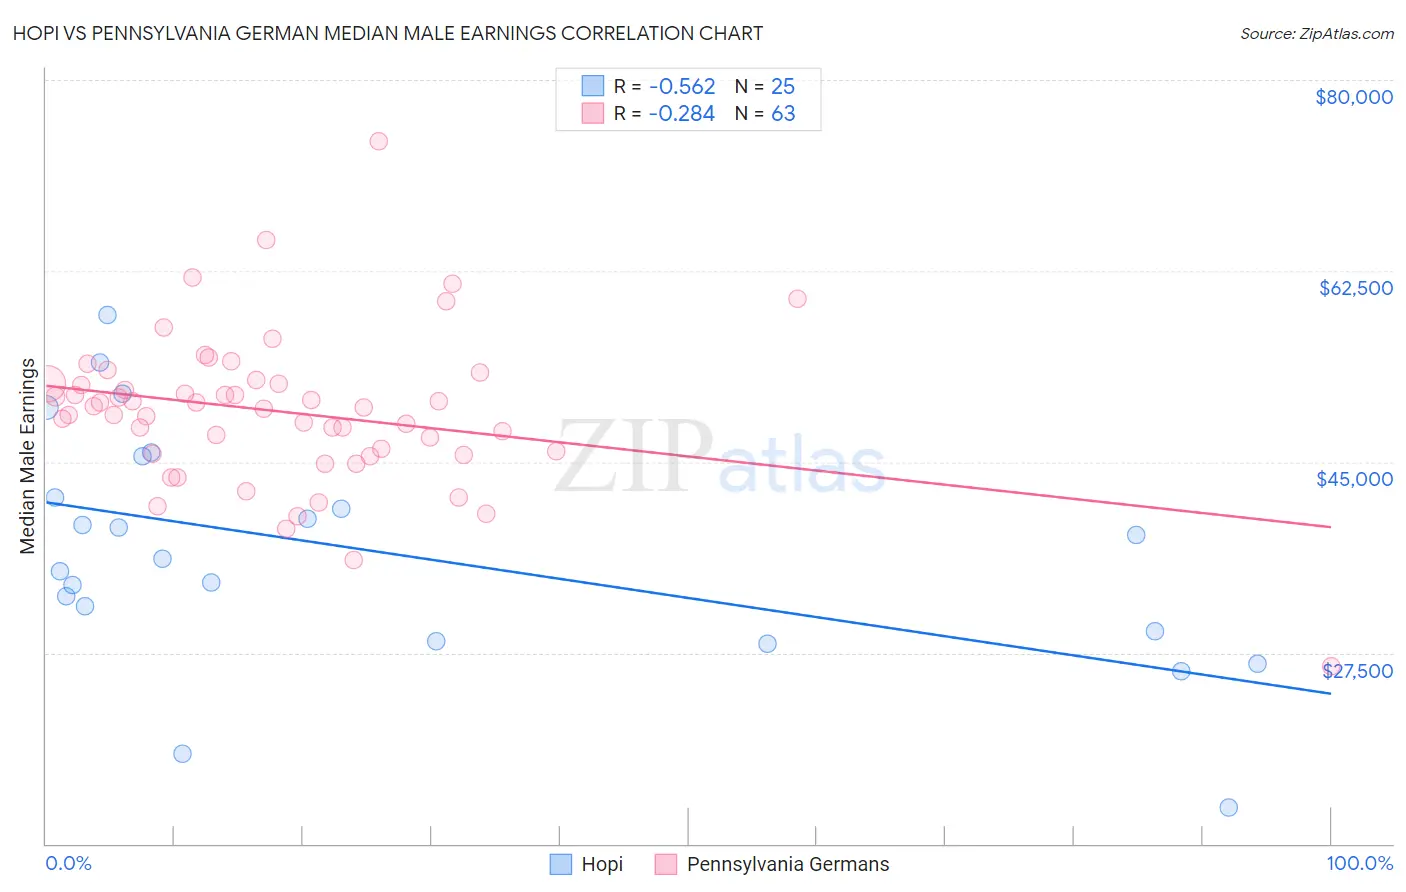
Hopi vs Pennsylvania German Median Male Earnings Correlation Chart
The statistical analysis conducted on geographies consisting of 74,728,825 people shows a substantial negative correlation between the proportion of Hopi and median male earnings in the United States with a correlation coefficient (R) of -0.562 and weighted average of $42,060. Similarly, the statistical analysis conducted on geographies consisting of 233,999,386 people shows a weak negative correlation between the proportion of Pennsylvania Germans and median male earnings in the United States with a correlation coefficient (R) of -0.284 and weighted average of $50,878, a difference of 21.0%.
Median Male Earnings Correlation Summary
| Measurement | Hopi | Pennsylvania German |
| Minimum | $13,333 | $26,250 |
| Maximum | $58,516 | $74,375 |
| Range | $45,183 | $48,125 |
| Mean | $36,698 | $49,588 |
| Median | $36,172 | $50,000 |
| Interquartile 25% (IQ1) | $29,042 | $45,795 |
| Interquartile 75% (IQ3) | $43,616 | $52,150 |
| Interquartile Range (IQR) | $14,573 | $6,355 |
| Standard Deviation (Sample) | $10,705 | $7,111 |
| Standard Deviation (Population) | $10,489 | $7,054 |
Similar Demographics by Median Male Earnings
Demographics Similar to Hopi by Median Male Earnings
In terms of median male earnings, the demographic groups most similar to Hopi are Navajo ($42,098, a difference of 0.090%), Pima ($42,357, a difference of 0.71%), Arapaho ($41,758, a difference of 0.72%), Lumbee ($41,715, a difference of 0.83%), and Crow ($42,434, a difference of 0.89%).
| Demographics | Rating | Rank | Median Male Earnings |
| Immigrants | Congo | 0.0 /100 | #333 | Tragic $44,204 |
| Immigrants | Yemen | 0.0 /100 | #334 | Tragic $44,083 |
| Spanish American Indians | 0.0 /100 | #335 | Tragic $44,010 |
| Immigrants | Cuba | 0.0 /100 | #336 | Tragic $43,461 |
| Menominee | 0.0 /100 | #337 | Tragic $42,581 |
| Crow | 0.0 /100 | #338 | Tragic $42,434 |
| Pima | 0.0 /100 | #339 | Tragic $42,357 |
| Navajo | 0.0 /100 | #340 | Tragic $42,098 |
| Hopi | 0.0 /100 | #341 | Tragic $42,060 |
| Arapaho | 0.0 /100 | #342 | Tragic $41,758 |
| Lumbee | 0.0 /100 | #343 | Tragic $41,715 |
| Pueblo | 0.0 /100 | #344 | Tragic $41,314 |
| Puerto Ricans | 0.0 /100 | #345 | Tragic $40,071 |
| Tohono O'odham | 0.0 /100 | #346 | Tragic $39,543 |
| Yup'ik | 0.0 /100 | #347 | Tragic $39,504 |
Demographics Similar to Pennsylvania Germans by Median Male Earnings
In terms of median male earnings, the demographic groups most similar to Pennsylvania Germans are Immigrants from Western Africa ($50,940, a difference of 0.12%), Immigrants from Barbados ($50,795, a difference of 0.16%), Malaysian ($50,772, a difference of 0.21%), American ($50,761, a difference of 0.23%), and West Indian ($50,682, a difference of 0.39%).
| Demographics | Rating | Rank | Median Male Earnings |
| Immigrants | Trinidad and Tobago | 4.5 /100 | #229 | Tragic $51,376 |
| Immigrants | Nigeria | 4.2 /100 | #230 | Tragic $51,310 |
| Barbadians | 3.9 /100 | #231 | Tragic $51,236 |
| Sudanese | 3.9 /100 | #232 | Tragic $51,216 |
| Aleuts | 3.7 /100 | #233 | Tragic $51,168 |
| Cape Verdeans | 3.5 /100 | #234 | Tragic $51,103 |
| Immigrants | Western Africa | 3.0 /100 | #235 | Tragic $50,940 |
| Pennsylvania Germans | 2.8 /100 | #236 | Tragic $50,878 |
| Immigrants | Barbados | 2.6 /100 | #237 | Tragic $50,795 |
| Malaysians | 2.5 /100 | #238 | Tragic $50,772 |
| Americans | 2.5 /100 | #239 | Tragic $50,761 |
| West Indians | 2.3 /100 | #240 | Tragic $50,682 |
| Immigrants | St. Vincent and the Grenadines | 2.3 /100 | #241 | Tragic $50,665 |
| Guyanese | 2.2 /100 | #242 | Tragic $50,613 |
| French American Indians | 2.2 /100 | #243 | Tragic $50,611 |