Hopi vs Pennsylvania German In Labor Force | Age 45-54

COMPARE

Hopi
Race
Ancestry
AfghanAfricanAlaska NativeAlaskan AthabascanAlbanianAleutAlsatianAmericanApacheArabArapahoArgentineanArmenianAssyrian/Chaldean/SyriacAustralianAustrianBahamianBangladeshiBarbadianBasqueBelgianBelizeanBermudanBhutaneseBlackfeetBolivianBrazilianBritishBritish West IndianBulgarianBurmeseCajunCambodianCanadianCape VerdeanCarpatho RusynCelticCentral AmericanCentral American IndianCherokeeCheyenneChickasawChileanChineseChippewaChoctawColombianColvilleComancheCosta RicanCreeCreekCroatianCrowCubanCypriotCzechCzechoslovakianDanishDelawareDominicanDutchDutch West IndianEastern EuropeanEcuadorianEgyptianEnglishEstonianEthiopianEuropeanFijianFilipinoFinnishFrenchFrench American IndianFrench CanadianGermanGerman RussianGhanaianGreekGuamanian/ChamorroGuatemalanGuyaneseHaitianHmongHonduranHopiHoumaHungarianIcelanderIndian (Asian)IndonesianInupiatIranianIraqiIrishIroquoisIsraeliItalianJamaicanJapaneseJordanianKenyanKiowaKoreanLaotianLatvianLebaneseLiberianLithuanianLumbeeLuxembourgerMacedonianMalaysianMalteseMarshalleseMenomineeMexicanMexican American IndianMongolianMoroccanNative HawaiianNavajoNepaleseNew ZealanderNicaraguanNigerianNorthern EuropeanNorwegianOkinawanOsageOttawaPaiutePakistaniPalestinianPanamanianParaguayanPeruvianPimaPolishPortuguesePotawatomiPuebloPuerto RicanPuget Sound SalishRomanianRussianSalvadoranSamoanScandinavianScotch-IrishScottishSeminoleSenegaleseSerbianShoshoneSierra LeoneanSiouxSlavicSlovakSloveneSomaliSouth AfricanSouth AmericanSouth American IndianSoviet UnionSpaniardSpanishSpanish AmericanSpanish American IndianSri LankanSubsaharan AfricanSudaneseSwedishSwissSyrianTaiwaneseThaiTlingit-HaidaTohono O'OdhamTonganTrinidadian and TobagonianTsimshianTurkishU.S. Virgin IslanderUgandanUkrainianUruguayanUteVenezuelanVietnameseWelshWest IndianYakamaYaquiYugoslavianYumanYup'ikZimbabwean
Immigration
NonimmigrantsImmigrantsAfghanistanAfricaAlbaniaArgentinaArmeniaAsiaAustraliaAustriaBahamasBangladeshBarbadosBelarusBelgiumBelizeBoliviaBosnia and HerzegovinaBrazilBulgariaBurma/MyanmarCabo VerdeCambodiaCameroonCanadaCaribbeanCentral AmericaChileChinaColombiaCongoCosta RicaCroatiaCubaCzechoslovakiaDenmarkDominicaDominican RepublicEastern AfricaEastern AsiaEastern EuropeEcuadorEgyptEl SalvadorEnglandEritreaEthiopiaEuropeFijiFranceGermanyGhanaGreeceGrenadaGuatemalaGuyanaHaitiHondurasHong KongHungaryIndiaIndonesiaIranIraqIrelandIsraelItalyJamaicaJapanJordanKazakhstanKenyaKoreaKuwaitLaosLatin AmericaLatviaLebanonLiberiaLithuaniaMalaysiaMexicoMicronesiaMiddle AfricaMoldovaMoroccoNepalNetherlandsNicaraguaNigeriaNorth AmericaNorth MacedoniaNorthern AfricaNorthern EuropeNorwayOceaniaPakistanPanamaPeruPhilippinesPolandPortugalRomaniaRussiaSaudi ArabiaScotlandSenegalSerbiaSierra LeoneSingaporeSomaliaSouth AfricaSouth AmericaSouth Central AsiaSouth Eastern AsiaSouthern EuropeSpainSri LankaSt. Vincent and the GrenadinesSudanSwedenSwitzerlandSyriaTaiwanThailandTrinidad and TobagoTurkeyUgandaUkraineUruguayUzbekistanVenezuelaVietnamWest IndiesWestern AfricaWestern AsiaWestern EuropeYemenZaireZimbabweAzores
Pennsylvania German
Race
Ancestry
AfghanAfricanAlaska NativeAlaskan AthabascanAlbanianAleutAlsatianAmericanApacheArabArapahoArgentineanArmenianAssyrian/Chaldean/SyriacAustralianAustrianBahamianBangladeshiBarbadianBasqueBelgianBelizeanBermudanBhutaneseBlackfeetBolivianBrazilianBritishBritish West IndianBulgarianBurmeseCajunCambodianCanadianCape VerdeanCarpatho RusynCelticCentral AmericanCentral American IndianCherokeeCheyenneChickasawChileanChineseChippewaChoctawColombianColvilleComancheCosta RicanCreeCreekCroatianCrowCubanCypriotCzechCzechoslovakianDanishDelawareDominicanDutchDutch West IndianEastern EuropeanEcuadorianEgyptianEnglishEstonianEthiopianEuropeanFijianFilipinoFinnishFrenchFrench American IndianFrench CanadianGermanGerman RussianGhanaianGreekGuamanian/ChamorroGuatemalanGuyaneseHaitianHmongHonduranHoumaHungarianIcelanderIndian (Asian)IndonesianInupiatIranianIraqiIrishIroquoisIsraeliItalianJamaicanJapaneseJordanianKenyanKiowaKoreanLaotianLatvianLebaneseLiberianLithuanianLumbeeLuxembourgerMacedonianMalaysianMalteseMarshalleseMenomineeMexicanMexican American IndianMongolianMoroccanNative HawaiianNavajoNepaleseNew ZealanderNicaraguanNigerianNorthern EuropeanNorwegianOkinawanOsageOttawaPaiutePakistaniPalestinianPanamanianParaguayanPennsylvania GermanPeruvianPimaPolishPortuguesePotawatomiPuebloPuerto RicanPuget Sound SalishRomanianRussianSalvadoranSamoanScandinavianScotch-IrishScottishSeminoleSenegaleseSerbianShoshoneSierra LeoneanSiouxSlavicSlovakSloveneSomaliSouth AfricanSouth AmericanSouth American IndianSoviet UnionSpaniardSpanishSpanish AmericanSpanish American IndianSri LankanSubsaharan AfricanSudaneseSwedishSwissSyrianTaiwaneseThaiTlingit-HaidaTohono O'OdhamTonganTrinidadian and TobagonianTsimshianTurkishU.S. Virgin IslanderUgandanUkrainianUruguayanUteVenezuelanVietnameseWelshWest IndianYakamaYaquiYugoslavianYumanYup'ikZimbabwean
Immigration
NonimmigrantsImmigrantsAfghanistanAfricaAlbaniaArgentinaArmeniaAsiaAustraliaAustriaBahamasBangladeshBarbadosBelarusBelgiumBelizeBoliviaBosnia and HerzegovinaBrazilBulgariaBurma/MyanmarCabo VerdeCambodiaCameroonCanadaCaribbeanCentral AmericaChileChinaColombiaCongoCosta RicaCroatiaCubaCzechoslovakiaDenmarkDominicaDominican RepublicEastern AfricaEastern AsiaEastern EuropeEcuadorEgyptEl SalvadorEnglandEritreaEthiopiaEuropeFijiFranceGermanyGhanaGreeceGrenadaGuatemalaGuyanaHaitiHondurasHong KongHungaryIndiaIndonesiaIranIraqIrelandIsraelItalyJamaicaJapanJordanKazakhstanKenyaKoreaKuwaitLaosLatin AmericaLatviaLebanonLiberiaLithuaniaMalaysiaMexicoMicronesiaMiddle AfricaMoldovaMoroccoNepalNetherlandsNicaraguaNigeriaNorth AmericaNorth MacedoniaNorthern AfricaNorthern EuropeNorwayOceaniaPakistanPanamaPeruPhilippinesPolandPortugalRomaniaRussiaSaudi ArabiaScotlandSenegalSerbiaSierra LeoneSingaporeSomaliaSouth AfricaSouth AmericaSouth Central AsiaSouth Eastern AsiaSouthern EuropeSpainSri LankaSt. Vincent and the GrenadinesSudanSwedenSwitzerlandSyriaTaiwanThailandTrinidad and TobagoTurkeyUgandaUkraineUruguayUzbekistanVenezuelaVietnamWest IndiesWestern AfricaWestern AsiaWestern EuropeYemenZaireZimbabweAzores
In Labor Force | Age 45-54
Income
Poverty
Unemployment
Labor Participation
Family Structure
Vehicle Availability
Education Level
Disability

In Labor Force | Age 45-54 Comparison

Hopi

Pennsylvania Germans

Tragic
Tragic
75.0%
IN LABOR FORCE | AGE 45-54
0.0/ 100
METRIC RATING
343rd/ 347
METRIC RANK
81.6%
IN LABOR FORCE | AGE 45-54
0.2/ 100
METRIC RATING
252nd/ 347
METRIC RANK

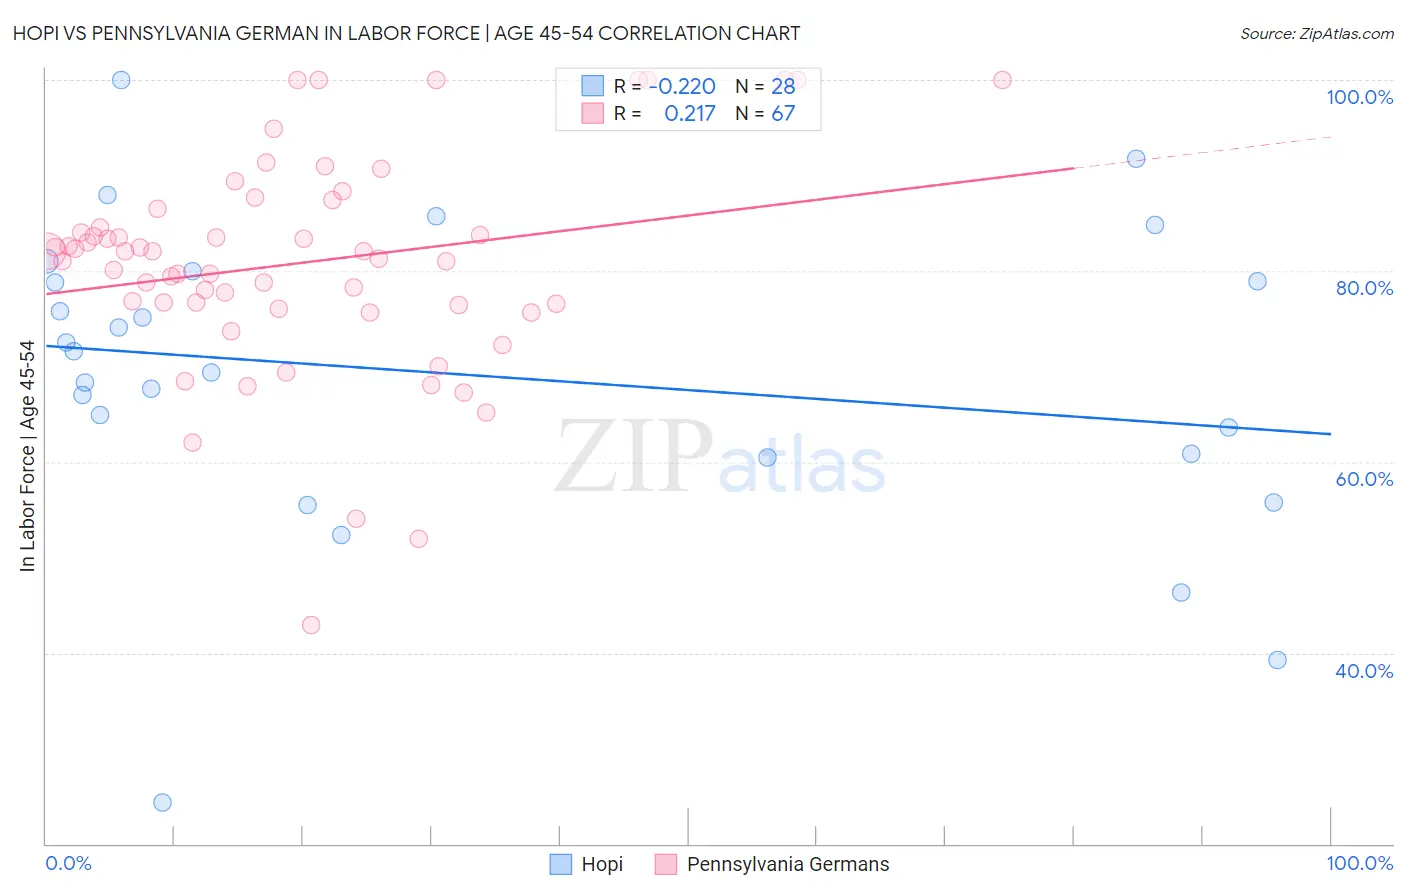
Hopi vs Pennsylvania German In Labor Force | Age 45-54 Correlation Chart

The statistical analysis conducted on geographies consisting of 74,732,664 people shows a weak negative correlation between the proportion of Hopi and labor force participation rate among population between the ages 45 and 54 in the United States with a correlation coefficient (R) of -0.220 and weighted average of 75.0%. Similarly, the statistical analysis conducted on geographies consisting of 234,049,036 people shows a weak positive correlation between the proportion of Pennsylvania Germans and labor force participation rate among population between the ages 45 and 54 in the United States with a correlation coefficient (R) of 0.217 and weighted average of 81.6%, a difference of 8.8%.
Hopi vs Pennsylvania German In Labor Force | Age 45-54

In Labor Force | Age 45-54 Correlation Summary

MeasurementHopiPennsylvania German
Minimum24.3%42.9%
Maximum100.0%100.0%
Range75.7%57.1%
Mean69.1%80.8%
Median70.4%82.0%
Interquartile 25% (IQ1)60.7%76.5%
Interquartile 75% (IQ3)79.4%86.5%
Interquartile Range (IQR)18.8%10.0%
Standard Deviation (Sample)16.3%11.4%
Standard Deviation (Population)16.0%11.3%

Similar Demographics by In Labor Force | Age 45-54

Demographics Similar to Hopi by In Labor Force | Age 45-54

In terms of in labor force | age 45-54, the demographic groups most similar to Hopi are Tohono O'odham (75.1%, a difference of 0.18%), Pueblo (75.5%, a difference of 0.67%), Immigrants from Yemen (74.4%, a difference of 0.78%), Lumbee (75.6%, a difference of 0.79%), and Puerto Rican (75.9%, a difference of 1.3%).
DemographicsRating | RankIn Labor Force | Age 45-54
Natives/Alaskans
0.0
/100
|
#333
Tragic
77.1%
Apache
0.0
/100
|
#334
Tragic
77.1%
Arapaho
0.0
/100
|
#335
Tragic
77.1%
Paiute
0.0
/100
|
#336
Tragic
76.7%
Ute
0.0
/100
|
#337
Tragic
76.6%
Yuman
0.0
/100
|
#338
Tragic
76.3%
Puerto Ricans
0.0
/100
|
#339
Tragic
75.9%
Lumbee
0.0
/100
|
#340
Tragic
75.6%
Pueblo
0.0
/100
|
#341
Tragic
75.5%
Tohono O'odham
0.0
/100
|
#342
Tragic
75.1%
Hopi
0.0
/100
|
#343
Tragic
75.0%
Immigrants | Yemen
0.0
/100
|
#344
Tragic
74.4%
Houma
0.0
/100
|
#345
Tragic
74.1%
Pima
0.0
/100
|
#346
Tragic
72.8%
Navajo
0.0
/100
|
#347
Tragic
72.8%

Demographics Similar to Pennsylvania Germans by In Labor Force | Age 45-54

In terms of in labor force | age 45-54, the demographic groups most similar to Pennsylvania Germans are Guamanian/Chamorro (81.6%, a difference of 0.020%), Japanese (81.6%, a difference of 0.030%), Immigrants from Laos (81.6%, a difference of 0.030%), Immigrants from Armenia (81.7%, a difference of 0.040%), and Scotch-Irish (81.6%, a difference of 0.050%).
DemographicsRating | RankIn Labor Force | Age 45-54
Alaska Natives
0.4
/100
|
#245
Tragic
81.8%
Alaskan Athabascans
0.4
/100
|
#246
Tragic
81.8%
Central Americans
0.4
/100
|
#247
Tragic
81.7%
Puget Sound Salish
0.3
/100
|
#248
Tragic
81.7%
Hmong
0.3
/100
|
#249
Tragic
81.7%
Immigrants | Armenia
0.2
/100
|
#250
Tragic
81.7%
Guamanians/Chamorros
0.2
/100
|
#251
Tragic
81.6%
Pennsylvania Germans
0.2
/100
|
#252
Tragic
81.6%
Japanese
0.2
/100
|
#253
Tragic
81.6%
Immigrants | Laos
0.2
/100
|
#254
Tragic
81.6%
Scotch-Irish
0.2
/100
|
#255
Tragic
81.6%
Barbadians
0.1
/100
|
#256
Tragic
81.6%
Immigrants | Congo
0.1
/100
|
#257
Tragic
81.6%
Immigrants | Fiji
0.1
/100
|
#258
Tragic
81.5%
Guyanese
0.1
/100
|
#259
Tragic
81.5%