Hopi vs Pennsylvania German 9th Grade
COMPARE
Hopi
Pennsylvania German
9th Grade
9th Grade Comparison
Hopi
Pennsylvania Germans
94.8%
9TH GRADE
37.1/ 100
METRIC RATING
186th/ 347
METRIC RANK
93.3%
9TH GRADE
0.0/ 100
METRIC RATING
290th/ 347
METRIC RANK
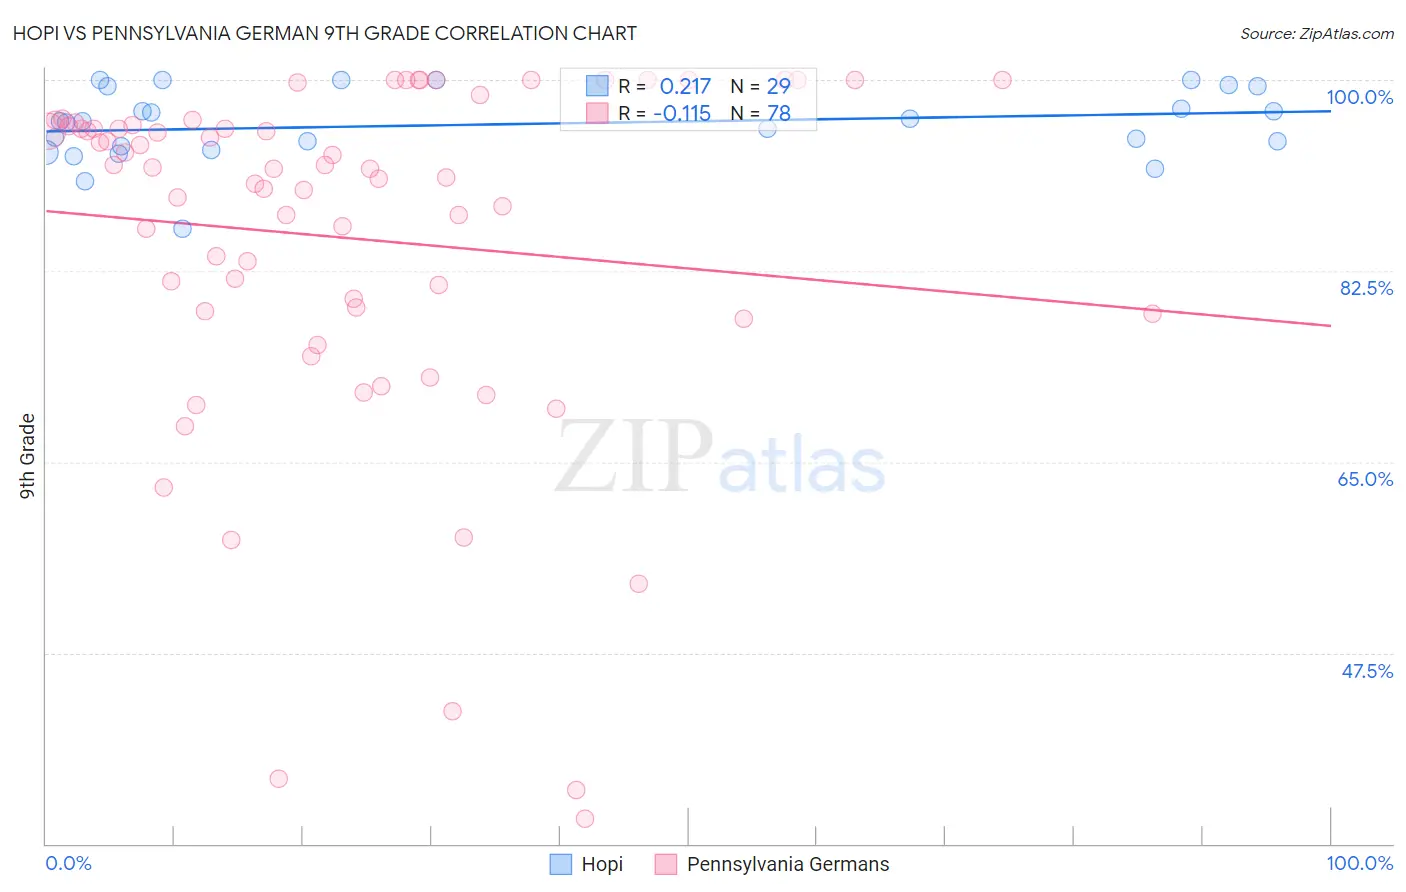
Hopi vs Pennsylvania German 9th Grade Correlation Chart
The statistical analysis conducted on geographies consisting of 74,739,957 people shows a weak positive correlation between the proportion of Hopi and percentage of population with at least 9th grade education in the United States with a correlation coefficient (R) of 0.217 and weighted average of 94.8%. Similarly, the statistical analysis conducted on geographies consisting of 234,103,120 people shows a poor negative correlation between the proportion of Pennsylvania Germans and percentage of population with at least 9th grade education in the United States with a correlation coefficient (R) of -0.115 and weighted average of 93.3%, a difference of 1.6%.
9th Grade Correlation Summary
| Measurement | Hopi | Pennsylvania German |
| Minimum | 86.4% | 32.3% |
| Maximum | 100.0% | 100.0% |
| Range | 13.6% | 67.7% |
| Mean | 95.9% | 85.5% |
| Median | 96.2% | 91.9% |
| Interquartile 25% (IQ1) | 93.8% | 78.8% |
| Interquartile 75% (IQ3) | 99.4% | 95.8% |
| Interquartile Range (IQR) | 5.7% | 17.0% |
| Standard Deviation (Sample) | 3.3% | 16.2% |
| Standard Deviation (Population) | 3.2% | 16.1% |
Similar Demographics by 9th Grade
Demographics Similar to Hopi by 9th Grade
In terms of 9th grade, the demographic groups most similar to Hopi are Argentinean (94.8%, a difference of 0.0%), Liberian (94.8%, a difference of 0.0%), Guamanian/Chamorro (94.8%, a difference of 0.010%), Immigrants from Nepal (94.8%, a difference of 0.020%), and Immigrants from Albania (94.8%, a difference of 0.020%).
| Demographics | Rating | Rank | 9th Grade |
| Immigrants | Venezuela | 46.5 /100 | #179 | Average 94.9% |
| Immigrants | Uganda | 43.1 /100 | #180 | Average 94.8% |
| Sierra Leoneans | 42.7 /100 | #181 | Average 94.8% |
| Seminole | 42.5 /100 | #182 | Average 94.8% |
| Immigrants | Nepal | 39.7 /100 | #183 | Fair 94.8% |
| Argentineans | 37.6 /100 | #184 | Fair 94.8% |
| Liberians | 37.4 /100 | #185 | Fair 94.8% |
| Hopi | 37.1 /100 | #186 | Fair 94.8% |
| Guamanians/Chamorros | 35.5 /100 | #187 | Fair 94.8% |
| Immigrants | Albania | 34.5 /100 | #188 | Fair 94.8% |
| Immigrants | Argentina | 34.4 /100 | #189 | Fair 94.8% |
| Sudanese | 32.7 /100 | #190 | Fair 94.7% |
| Assyrians/Chaldeans/Syriacs | 32.0 /100 | #191 | Fair 94.7% |
| Immigrants | Northern Africa | 30.7 /100 | #192 | Fair 94.7% |
| Paraguayans | 30.1 /100 | #193 | Fair 94.7% |
Demographics Similar to Pennsylvania Germans by 9th Grade
In terms of 9th grade, the demographic groups most similar to Pennsylvania Germans are Immigrants from West Indies (93.3%, a difference of 0.0%), Immigrants from South Eastern Asia (93.3%, a difference of 0.070%), British West Indian (93.2%, a difference of 0.080%), Immigrants from Barbados (93.4%, a difference of 0.10%), and Immigrants from St. Vincent and the Grenadines (93.4%, a difference of 0.10%).
| Demographics | Rating | Rank | 9th Grade |
| Barbadians | 0.0 /100 | #283 | Tragic 93.5% |
| Bangladeshis | 0.0 /100 | #284 | Tragic 93.4% |
| Immigrants | Peru | 0.0 /100 | #285 | Tragic 93.4% |
| Immigrants | Barbados | 0.0 /100 | #286 | Tragic 93.4% |
| Immigrants | St. Vincent and the Grenadines | 0.0 /100 | #287 | Tragic 93.4% |
| Immigrants | South Eastern Asia | 0.0 /100 | #288 | Tragic 93.3% |
| Immigrants | West Indies | 0.0 /100 | #289 | Tragic 93.3% |
| Pennsylvania Germans | 0.0 /100 | #290 | Tragic 93.3% |
| British West Indians | 0.0 /100 | #291 | Tragic 93.2% |
| Immigrants | Laos | 0.0 /100 | #292 | Tragic 93.2% |
| Sri Lankans | 0.0 /100 | #293 | Tragic 93.2% |
| Cubans | 0.0 /100 | #294 | Tragic 93.2% |
| Immigrants | Burma/Myanmar | 0.0 /100 | #295 | Tragic 93.1% |
| Indonesians | 0.0 /100 | #296 | Tragic 93.1% |
| Fijians | 0.0 /100 | #297 | Tragic 93.1% |