French American Indian vs Pennsylvania German Median Male Earnings
COMPARE
French American Indian
Pennsylvania German
Median Male Earnings
Median Male Earnings Comparison
French American Indians
Pennsylvania Germans
$50,611
MEDIAN MALE EARNINGS
2.2/ 100
METRIC RATING
243rd/ 347
METRIC RANK
$50,878
MEDIAN MALE EARNINGS
2.8/ 100
METRIC RATING
236th/ 347
METRIC RANK
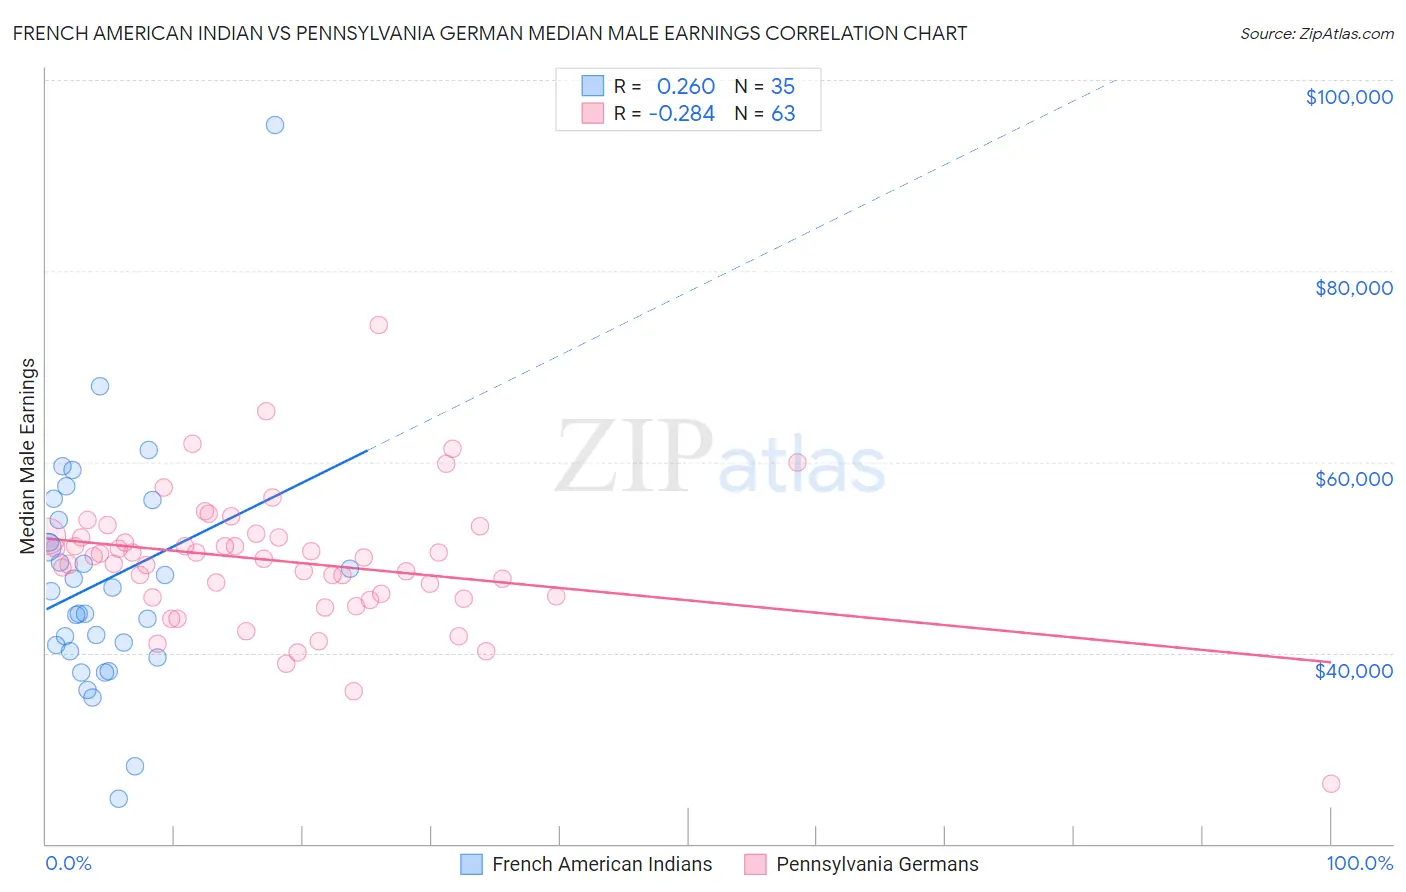
French American Indian vs Pennsylvania German Median Male Earnings Correlation Chart
The statistical analysis conducted on geographies consisting of 131,955,005 people shows a weak positive correlation between the proportion of French American Indians and median male earnings in the United States with a correlation coefficient (R) of 0.260 and weighted average of $50,611. Similarly, the statistical analysis conducted on geographies consisting of 233,999,386 people shows a weak negative correlation between the proportion of Pennsylvania Germans and median male earnings in the United States with a correlation coefficient (R) of -0.284 and weighted average of $50,878, a difference of 0.53%.
Median Male Earnings Correlation Summary
| Measurement | French American Indian | Pennsylvania German |
| Minimum | $24,718 | $26,250 |
| Maximum | $95,250 | $74,375 |
| Range | $70,532 | $48,125 |
| Mean | $47,583 | $49,588 |
| Median | $46,502 | $50,000 |
| Interquartile 25% (IQ1) | $40,215 | $45,795 |
| Interquartile 75% (IQ3) | $53,921 | $52,150 |
| Interquartile Range (IQR) | $13,706 | $6,355 |
| Standard Deviation (Sample) | $12,435 | $7,111 |
| Standard Deviation (Population) | $12,256 | $7,054 |
Demographics Similar to French American Indians and Pennsylvania Germans by Median Male Earnings
In terms of median male earnings, the demographic groups most similar to French American Indians are Guyanese ($50,613, a difference of 0.0%), Immigrants from St. Vincent and the Grenadines ($50,665, a difference of 0.11%), Houma ($50,547, a difference of 0.13%), West Indian ($50,682, a difference of 0.14%), and Hawaiian ($50,488, a difference of 0.24%). Similarly, the demographic groups most similar to Pennsylvania Germans are Immigrants from Western Africa ($50,940, a difference of 0.12%), Immigrants from Barbados ($50,795, a difference of 0.16%), Malaysian ($50,772, a difference of 0.21%), American ($50,761, a difference of 0.23%), and West Indian ($50,682, a difference of 0.39%).
| Demographics | Rating | Rank | Median Male Earnings |
| Immigrants | Trinidad and Tobago | 4.5 /100 | #229 | Tragic $51,376 |
| Immigrants | Nigeria | 4.2 /100 | #230 | Tragic $51,310 |
| Barbadians | 3.9 /100 | #231 | Tragic $51,236 |
| Sudanese | 3.9 /100 | #232 | Tragic $51,216 |
| Aleuts | 3.7 /100 | #233 | Tragic $51,168 |
| Cape Verdeans | 3.5 /100 | #234 | Tragic $51,103 |
| Immigrants | Western Africa | 3.0 /100 | #235 | Tragic $50,940 |
| Pennsylvania Germans | 2.8 /100 | #236 | Tragic $50,878 |
| Immigrants | Barbados | 2.6 /100 | #237 | Tragic $50,795 |
| Malaysians | 2.5 /100 | #238 | Tragic $50,772 |
| Americans | 2.5 /100 | #239 | Tragic $50,761 |
| West Indians | 2.3 /100 | #240 | Tragic $50,682 |
| Immigrants | St. Vincent and the Grenadines | 2.3 /100 | #241 | Tragic $50,665 |
| Guyanese | 2.2 /100 | #242 | Tragic $50,613 |
| French American Indians | 2.2 /100 | #243 | Tragic $50,611 |
| Houma | 2.0 /100 | #244 | Tragic $50,547 |
| Hawaiians | 1.9 /100 | #245 | Tragic $50,488 |
| Immigrants | Ecuador | 1.9 /100 | #246 | Tragic $50,474 |
| Sub-Saharan Africans | 1.8 /100 | #247 | Tragic $50,408 |
| Immigrants | Guyana | 1.6 /100 | #248 | Tragic $50,321 |
| Immigrants | Burma/Myanmar | 1.6 /100 | #249 | Tragic $50,298 |