Hopi vs Ethiopian Median Male Earnings
COMPARE
Hopi
Ethiopian
Median Male Earnings
Median Male Earnings Comparison
Hopi
Ethiopians
$42,060
MEDIAN MALE EARNINGS
0.0/ 100
METRIC RATING
341st/ 347
METRIC RANK
$56,243
MEDIAN MALE EARNINGS
84.8/ 100
METRIC RATING
142nd/ 347
METRIC RANK
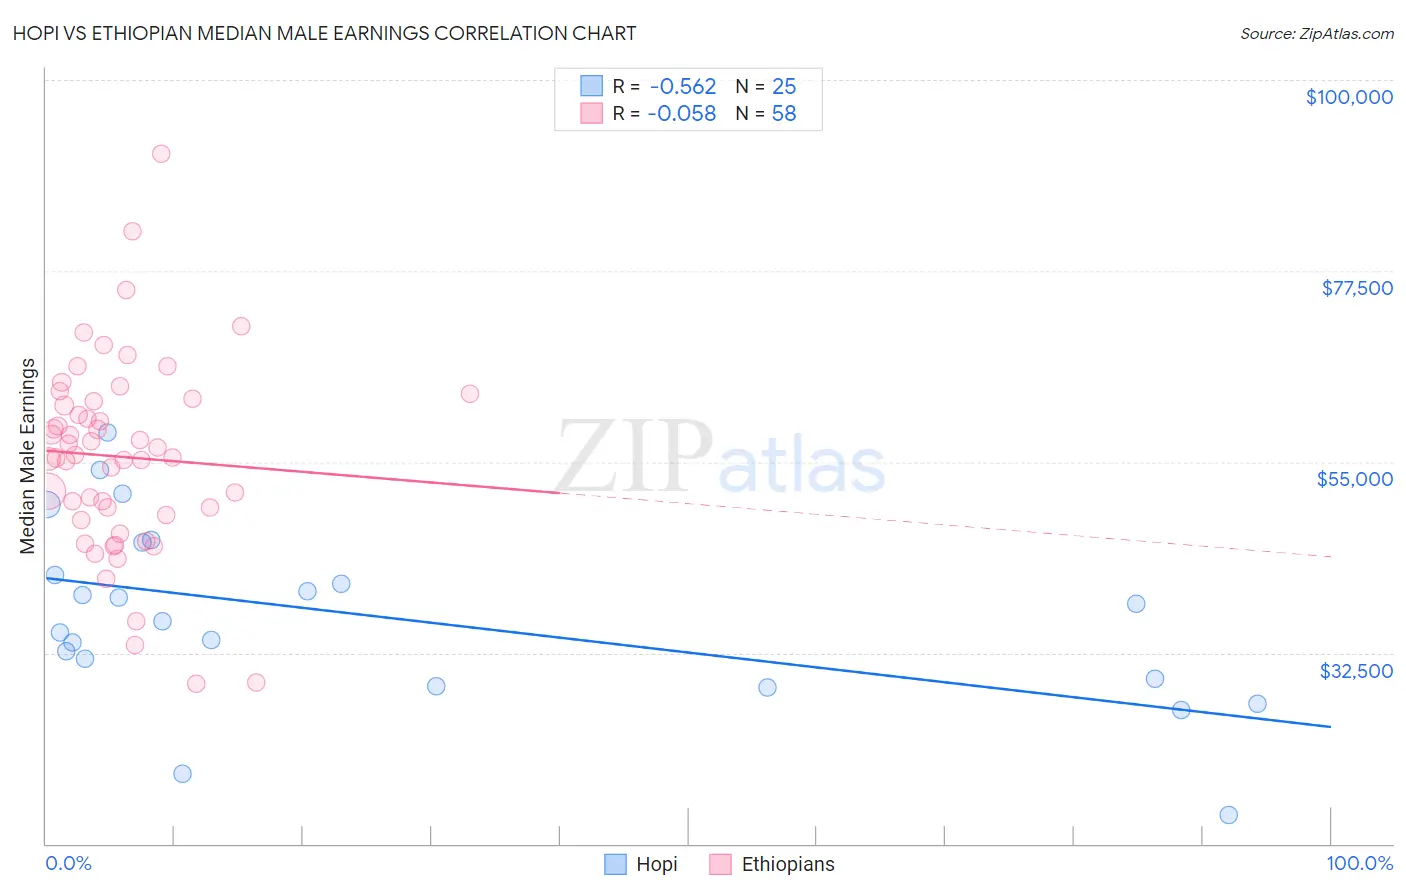
Hopi vs Ethiopian Median Male Earnings Correlation Chart
The statistical analysis conducted on geographies consisting of 74,728,825 people shows a substantial negative correlation between the proportion of Hopi and median male earnings in the United States with a correlation coefficient (R) of -0.562 and weighted average of $42,060. Similarly, the statistical analysis conducted on geographies consisting of 223,246,505 people shows a slight negative correlation between the proportion of Ethiopians and median male earnings in the United States with a correlation coefficient (R) of -0.058 and weighted average of $56,243, a difference of 33.7%.
Median Male Earnings Correlation Summary
| Measurement | Hopi | Ethiopian |
| Minimum | $13,333 | $28,882 |
| Maximum | $58,516 | $91,333 |
| Range | $45,183 | $62,451 |
| Mean | $36,698 | $55,598 |
| Median | $36,172 | $55,634 |
| Interquartile 25% (IQ1) | $29,042 | $48,793 |
| Interquartile 75% (IQ3) | $43,616 | $62,132 |
| Interquartile Range (IQR) | $14,573 | $13,339 |
| Standard Deviation (Sample) | $10,705 | $11,505 |
| Standard Deviation (Population) | $10,489 | $11,405 |
Similar Demographics by Median Male Earnings
Demographics Similar to Hopi by Median Male Earnings
In terms of median male earnings, the demographic groups most similar to Hopi are Navajo ($42,098, a difference of 0.090%), Pima ($42,357, a difference of 0.71%), Arapaho ($41,758, a difference of 0.72%), Lumbee ($41,715, a difference of 0.83%), and Crow ($42,434, a difference of 0.89%).
| Demographics | Rating | Rank | Median Male Earnings |
| Immigrants | Congo | 0.0 /100 | #333 | Tragic $44,204 |
| Immigrants | Yemen | 0.0 /100 | #334 | Tragic $44,083 |
| Spanish American Indians | 0.0 /100 | #335 | Tragic $44,010 |
| Immigrants | Cuba | 0.0 /100 | #336 | Tragic $43,461 |
| Menominee | 0.0 /100 | #337 | Tragic $42,581 |
| Crow | 0.0 /100 | #338 | Tragic $42,434 |
| Pima | 0.0 /100 | #339 | Tragic $42,357 |
| Navajo | 0.0 /100 | #340 | Tragic $42,098 |
| Hopi | 0.0 /100 | #341 | Tragic $42,060 |
| Arapaho | 0.0 /100 | #342 | Tragic $41,758 |
| Lumbee | 0.0 /100 | #343 | Tragic $41,715 |
| Pueblo | 0.0 /100 | #344 | Tragic $41,314 |
| Puerto Ricans | 0.0 /100 | #345 | Tragic $40,071 |
| Tohono O'odham | 0.0 /100 | #346 | Tragic $39,543 |
| Yup'ik | 0.0 /100 | #347 | Tragic $39,504 |
Demographics Similar to Ethiopians by Median Male Earnings
In terms of median male earnings, the demographic groups most similar to Ethiopians are Danish ($56,246, a difference of 0.0%), Zimbabwean ($56,302, a difference of 0.10%), Luxembourger ($56,300, a difference of 0.10%), Slovak ($56,306, a difference of 0.11%), and Sri Lankan ($56,136, a difference of 0.19%).
| Demographics | Rating | Rank | Median Male Earnings |
| Irish | 87.4 /100 | #135 | Excellent $56,464 |
| Immigrants | Saudi Arabia | 87.2 /100 | #136 | Excellent $56,452 |
| Slavs | 86.5 /100 | #137 | Excellent $56,390 |
| Slovaks | 85.5 /100 | #138 | Excellent $56,306 |
| Zimbabweans | 85.5 /100 | #139 | Excellent $56,302 |
| Luxembourgers | 85.5 /100 | #140 | Excellent $56,300 |
| Danes | 84.8 /100 | #141 | Excellent $56,246 |
| Ethiopians | 84.8 /100 | #142 | Excellent $56,243 |
| Sri Lankans | 83.4 /100 | #143 | Excellent $56,136 |
| Immigrants | Uganda | 82.4 /100 | #144 | Excellent $56,064 |
| Norwegians | 80.9 /100 | #145 | Excellent $55,965 |
| Immigrants | Chile | 80.7 /100 | #146 | Excellent $55,954 |
| Immigrants | Philippines | 78.4 /100 | #147 | Good $55,809 |
| Scottish | 78.2 /100 | #148 | Good $55,793 |
| English | 77.4 /100 | #149 | Good $55,747 |