Hopi vs Dutch West Indian Median Male Earnings
COMPARE
Hopi
Dutch West Indian
Median Male Earnings
Median Male Earnings Comparison
Hopi
Dutch West Indians
$42,060
MEDIAN MALE EARNINGS
0.0/ 100
METRIC RATING
341st/ 347
METRIC RANK
$46,656
MEDIAN MALE EARNINGS
0.0/ 100
METRIC RATING
306th/ 347
METRIC RANK
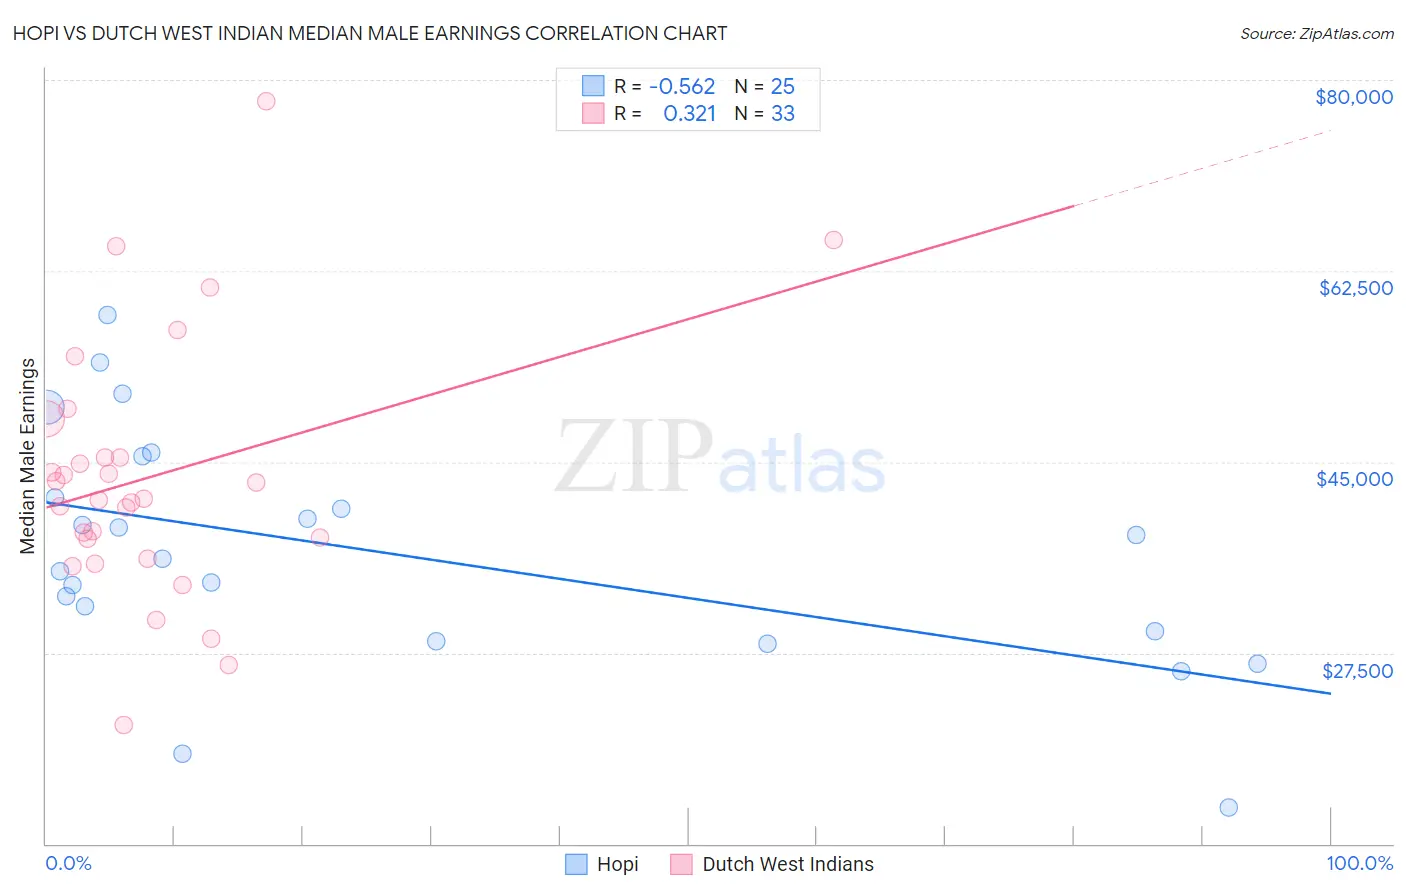
Hopi vs Dutch West Indian Median Male Earnings Correlation Chart
The statistical analysis conducted on geographies consisting of 74,728,825 people shows a substantial negative correlation between the proportion of Hopi and median male earnings in the United States with a correlation coefficient (R) of -0.562 and weighted average of $42,060. Similarly, the statistical analysis conducted on geographies consisting of 85,752,443 people shows a mild positive correlation between the proportion of Dutch West Indians and median male earnings in the United States with a correlation coefficient (R) of 0.321 and weighted average of $46,656, a difference of 10.9%.
Median Male Earnings Correlation Summary
| Measurement | Hopi | Dutch West Indian |
| Minimum | $13,333 | $20,833 |
| Maximum | $58,516 | $78,036 |
| Range | $45,183 | $57,203 |
| Mean | $36,698 | $43,636 |
| Median | $36,172 | $41,596 |
| Interquartile 25% (IQ1) | $29,042 | $37,034 |
| Interquartile 75% (IQ3) | $43,616 | $47,172 |
| Interquartile Range (IQR) | $14,573 | $10,138 |
| Standard Deviation (Sample) | $10,705 | $11,759 |
| Standard Deviation (Population) | $10,489 | $11,579 |
Similar Demographics by Median Male Earnings
Demographics Similar to Hopi by Median Male Earnings
In terms of median male earnings, the demographic groups most similar to Hopi are Navajo ($42,098, a difference of 0.090%), Pima ($42,357, a difference of 0.71%), Arapaho ($41,758, a difference of 0.72%), Lumbee ($41,715, a difference of 0.83%), and Crow ($42,434, a difference of 0.89%).
| Demographics | Rating | Rank | Median Male Earnings |
| Immigrants | Congo | 0.0 /100 | #333 | Tragic $44,204 |
| Immigrants | Yemen | 0.0 /100 | #334 | Tragic $44,083 |
| Spanish American Indians | 0.0 /100 | #335 | Tragic $44,010 |
| Immigrants | Cuba | 0.0 /100 | #336 | Tragic $43,461 |
| Menominee | 0.0 /100 | #337 | Tragic $42,581 |
| Crow | 0.0 /100 | #338 | Tragic $42,434 |
| Pima | 0.0 /100 | #339 | Tragic $42,357 |
| Navajo | 0.0 /100 | #340 | Tragic $42,098 |
| Hopi | 0.0 /100 | #341 | Tragic $42,060 |
| Arapaho | 0.0 /100 | #342 | Tragic $41,758 |
| Lumbee | 0.0 /100 | #343 | Tragic $41,715 |
| Pueblo | 0.0 /100 | #344 | Tragic $41,314 |
| Puerto Ricans | 0.0 /100 | #345 | Tragic $40,071 |
| Tohono O'odham | 0.0 /100 | #346 | Tragic $39,543 |
| Yup'ik | 0.0 /100 | #347 | Tragic $39,504 |
Demographics Similar to Dutch West Indians by Median Male Earnings
In terms of median male earnings, the demographic groups most similar to Dutch West Indians are Immigrants from Dominican Republic ($46,655, a difference of 0.0%), Ottawa ($46,611, a difference of 0.10%), Creek ($46,594, a difference of 0.13%), Cuban ($46,580, a difference of 0.16%), and Guatemalan ($46,736, a difference of 0.17%).
| Demographics | Rating | Rank | Median Male Earnings |
| Immigrants | Zaire | 0.1 /100 | #299 | Tragic $47,070 |
| U.S. Virgin Islanders | 0.1 /100 | #300 | Tragic $47,066 |
| Immigrants | Latin America | 0.1 /100 | #301 | Tragic $46,941 |
| Seminole | 0.1 /100 | #302 | Tragic $46,783 |
| Yaqui | 0.1 /100 | #303 | Tragic $46,777 |
| Bangladeshis | 0.1 /100 | #304 | Tragic $46,744 |
| Guatemalans | 0.0 /100 | #305 | Tragic $46,736 |
| Dutch West Indians | 0.0 /100 | #306 | Tragic $46,656 |
| Immigrants | Dominican Republic | 0.0 /100 | #307 | Tragic $46,655 |
| Ottawa | 0.0 /100 | #308 | Tragic $46,611 |
| Creek | 0.0 /100 | #309 | Tragic $46,594 |
| Cubans | 0.0 /100 | #310 | Tragic $46,580 |
| Apache | 0.0 /100 | #311 | Tragic $46,429 |
| Hispanics or Latinos | 0.0 /100 | #312 | Tragic $46,419 |
| Hondurans | 0.0 /100 | #313 | Tragic $46,374 |