Croatian vs Filipino Householder Income Over 65 years
COMPARE
Croatian
Filipino
Householder Income Over 65 years
Householder Income Over 65 years Comparison
Croatians
Filipinos
$63,225
HOUSEHOLDER INCOME OVER 65 YEARS
91.4/ 100
METRIC RATING
115th/ 347
METRIC RANK
$76,686
HOUSEHOLDER INCOME OVER 65 YEARS
100.0/ 100
METRIC RATING
4th/ 347
METRIC RANK
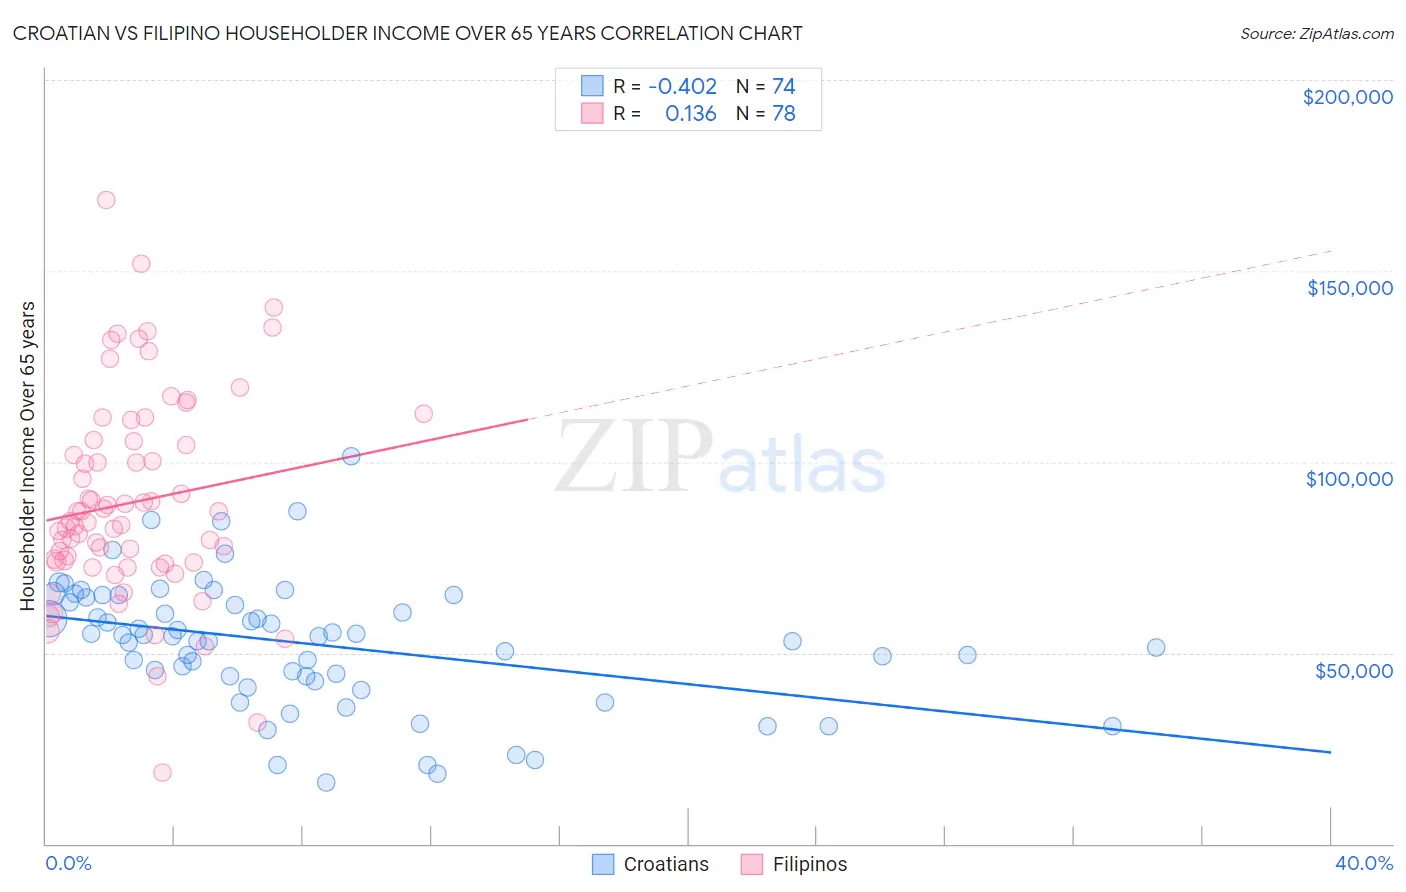
Croatian vs Filipino Householder Income Over 65 years Correlation Chart
The statistical analysis conducted on geographies consisting of 374,799,169 people shows a moderate negative correlation between the proportion of Croatians and household income with householder over the age of 65 in the United States with a correlation coefficient (R) of -0.402 and weighted average of $63,225. Similarly, the statistical analysis conducted on geographies consisting of 253,664,228 people shows a poor positive correlation between the proportion of Filipinos and household income with householder over the age of 65 in the United States with a correlation coefficient (R) of 0.136 and weighted average of $76,686, a difference of 21.3%.
Householder Income Over 65 years Correlation Summary
| Measurement | Croatian | Filipino |
| Minimum | $15,946 | $18,667 |
| Maximum | $101,389 | $168,449 |
| Range | $85,443 | $149,782 |
| Mean | $52,456 | $89,373 |
| Median | $54,474 | $84,207 |
| Interquartile 25% (IQ1) | $43,748 | $73,750 |
| Interquartile 75% (IQ3) | $64,490 | $105,277 |
| Interquartile Range (IQR) | $20,742 | $31,527 |
| Standard Deviation (Sample) | $16,776 | $26,949 |
| Standard Deviation (Population) | $16,663 | $26,776 |
Similar Demographics by Householder Income Over 65 years
Demographics Similar to Croatians by Householder Income Over 65 years
In terms of householder income over 65 years, the demographic groups most similar to Croatians are Guamanian/Chamorro ($63,187, a difference of 0.060%), Immigrants from Croatia ($63,168, a difference of 0.090%), Danish ($63,117, a difference of 0.17%), Immigrants from Saudi Arabia ($63,355, a difference of 0.20%), and Immigrants from Serbia ($63,387, a difference of 0.26%).
| Demographics | Rating | Rank | Householder Income Over 65 years |
| Palestinians | 95.1 /100 | #108 | Exceptional $63,800 |
| Europeans | 95.0 /100 | #109 | Exceptional $63,779 |
| Immigrants | Zimbabwe | 94.3 /100 | #110 | Exceptional $63,643 |
| Immigrants | Spain | 93.7 /100 | #111 | Exceptional $63,540 |
| Syrians | 93.4 /100 | #112 | Exceptional $63,494 |
| Immigrants | Serbia | 92.7 /100 | #113 | Exceptional $63,387 |
| Immigrants | Saudi Arabia | 92.4 /100 | #114 | Exceptional $63,355 |
| Croatians | 91.4 /100 | #115 | Exceptional $63,225 |
| Guamanians/Chamorros | 91.1 /100 | #116 | Exceptional $63,187 |
| Immigrants | Croatia | 90.9 /100 | #117 | Exceptional $63,168 |
| Danes | 90.5 /100 | #118 | Exceptional $63,117 |
| Immigrants | Jordan | 89.8 /100 | #119 | Excellent $63,041 |
| Ukrainians | 89.7 /100 | #120 | Excellent $63,032 |
| Immigrants | Vietnam | 89.5 /100 | #121 | Excellent $63,014 |
| Immigrants | Moldova | 88.7 /100 | #122 | Excellent $62,939 |
Demographics Similar to Filipinos by Householder Income Over 65 years
In terms of householder income over 65 years, the demographic groups most similar to Filipinos are Immigrants from Taiwan ($77,051, a difference of 0.48%), Iranian ($77,429, a difference of 0.97%), Chinese ($77,465, a difference of 1.0%), Immigrants from Iran ($75,081, a difference of 2.1%), and Bolivian ($74,245, a difference of 3.3%).
| Demographics | Rating | Rank | Householder Income Over 65 years |
| Chinese | 100.0 /100 | #1 | Exceptional $77,465 |
| Iranians | 100.0 /100 | #2 | Exceptional $77,429 |
| Immigrants | Taiwan | 100.0 /100 | #3 | Exceptional $77,051 |
| Filipinos | 100.0 /100 | #4 | Exceptional $76,686 |
| Immigrants | Iran | 100.0 /100 | #5 | Exceptional $75,081 |
| Bolivians | 100.0 /100 | #6 | Exceptional $74,245 |
| Immigrants | Bolivia | 100.0 /100 | #7 | Exceptional $73,434 |
| Immigrants | Singapore | 100.0 /100 | #8 | Exceptional $72,963 |
| Immigrants | India | 100.0 /100 | #9 | Exceptional $72,804 |
| Bhutanese | 100.0 /100 | #10 | Exceptional $72,288 |
| Thais | 100.0 /100 | #11 | Exceptional $72,099 |
| Cypriots | 100.0 /100 | #12 | Exceptional $71,714 |
| Immigrants | Hong Kong | 100.0 /100 | #13 | Exceptional $71,567 |
| Burmese | 100.0 /100 | #14 | Exceptional $71,139 |
| Native Hawaiians | 100.0 /100 | #15 | Exceptional $71,021 |