Bhutanese vs Filipino Householder Income Over 65 years
COMPARE
Bhutanese
Filipino
Householder Income Over 65 years
Householder Income Over 65 years Comparison
Bhutanese
Filipinos
$72,288
HOUSEHOLDER INCOME OVER 65 YEARS
100.0/ 100
METRIC RATING
10th/ 347
METRIC RANK
$76,686
HOUSEHOLDER INCOME OVER 65 YEARS
100.0/ 100
METRIC RATING
4th/ 347
METRIC RANK
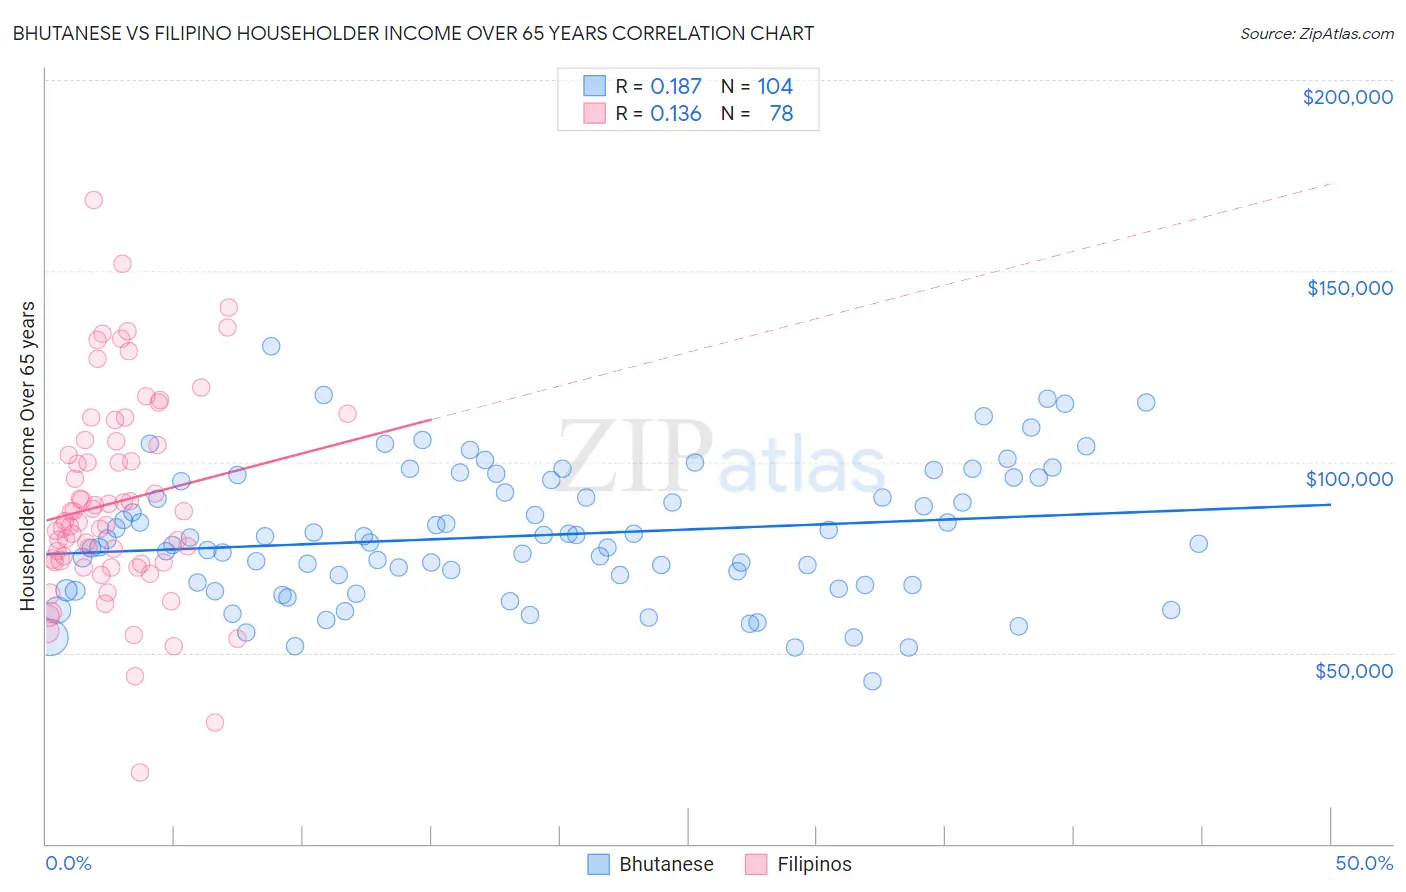
Bhutanese vs Filipino Householder Income Over 65 years Correlation Chart
The statistical analysis conducted on geographies consisting of 453,217,193 people shows a poor positive correlation between the proportion of Bhutanese and household income with householder over the age of 65 in the United States with a correlation coefficient (R) of 0.187 and weighted average of $72,288. Similarly, the statistical analysis conducted on geographies consisting of 253,664,228 people shows a poor positive correlation between the proportion of Filipinos and household income with householder over the age of 65 in the United States with a correlation coefficient (R) of 0.136 and weighted average of $76,686, a difference of 6.1%.
Householder Income Over 65 years Correlation Summary
| Measurement | Bhutanese | Filipino |
| Minimum | $42,695 | $18,667 |
| Maximum | $130,207 | $168,449 |
| Range | $87,512 | $149,782 |
| Mean | $80,718 | $89,373 |
| Median | $79,378 | $84,207 |
| Interquartile 25% (IQ1) | $67,810 | $73,750 |
| Interquartile 75% (IQ3) | $95,004 | $105,277 |
| Interquartile Range (IQR) | $27,195 | $31,527 |
| Standard Deviation (Sample) | $17,380 | $26,949 |
| Standard Deviation (Population) | $17,296 | $26,776 |
Demographics Similar to Bhutanese and Filipinos by Householder Income Over 65 years
In terms of householder income over 65 years, the demographic groups most similar to Bhutanese are Thai ($72,099, a difference of 0.26%), Immigrants from India ($72,804, a difference of 0.71%), Cypriot ($71,714, a difference of 0.80%), Immigrants from Singapore ($72,963, a difference of 0.93%), and Immigrants from Hong Kong ($71,567, a difference of 1.0%). Similarly, the demographic groups most similar to Filipinos are Immigrants from Taiwan ($77,051, a difference of 0.48%), Iranian ($77,429, a difference of 0.97%), Chinese ($77,465, a difference of 1.0%), Immigrants from Iran ($75,081, a difference of 2.1%), and Bolivian ($74,245, a difference of 3.3%).
| Demographics | Rating | Rank | Householder Income Over 65 years |
| Chinese | 100.0 /100 | #1 | Exceptional $77,465 |
| Iranians | 100.0 /100 | #2 | Exceptional $77,429 |
| Immigrants | Taiwan | 100.0 /100 | #3 | Exceptional $77,051 |
| Filipinos | 100.0 /100 | #4 | Exceptional $76,686 |
| Immigrants | Iran | 100.0 /100 | #5 | Exceptional $75,081 |
| Bolivians | 100.0 /100 | #6 | Exceptional $74,245 |
| Immigrants | Bolivia | 100.0 /100 | #7 | Exceptional $73,434 |
| Immigrants | Singapore | 100.0 /100 | #8 | Exceptional $72,963 |
| Immigrants | India | 100.0 /100 | #9 | Exceptional $72,804 |
| Bhutanese | 100.0 /100 | #10 | Exceptional $72,288 |
| Thais | 100.0 /100 | #11 | Exceptional $72,099 |
| Cypriots | 100.0 /100 | #12 | Exceptional $71,714 |
| Immigrants | Hong Kong | 100.0 /100 | #13 | Exceptional $71,567 |
| Burmese | 100.0 /100 | #14 | Exceptional $71,139 |
| Native Hawaiians | 100.0 /100 | #15 | Exceptional $71,021 |
| Okinawans | 100.0 /100 | #16 | Exceptional $70,846 |
| Immigrants | Korea | 100.0 /100 | #17 | Exceptional $70,696 |
| Eastern Europeans | 100.0 /100 | #18 | Exceptional $70,470 |
| Indians (Asian) | 100.0 /100 | #19 | Exceptional $70,238 |
| Immigrants | South Central Asia | 100.0 /100 | #20 | Exceptional $70,103 |