Finnish vs Filipino Householder Income Over 65 years
COMPARE
Finnish
Filipino
Householder Income Over 65 years
Householder Income Over 65 years Comparison
Finns
Filipinos
$59,535
HOUSEHOLDER INCOME OVER 65 YEARS
18.2/ 100
METRIC RATING
202nd/ 347
METRIC RANK
$76,686
HOUSEHOLDER INCOME OVER 65 YEARS
100.0/ 100
METRIC RATING
4th/ 347
METRIC RANK
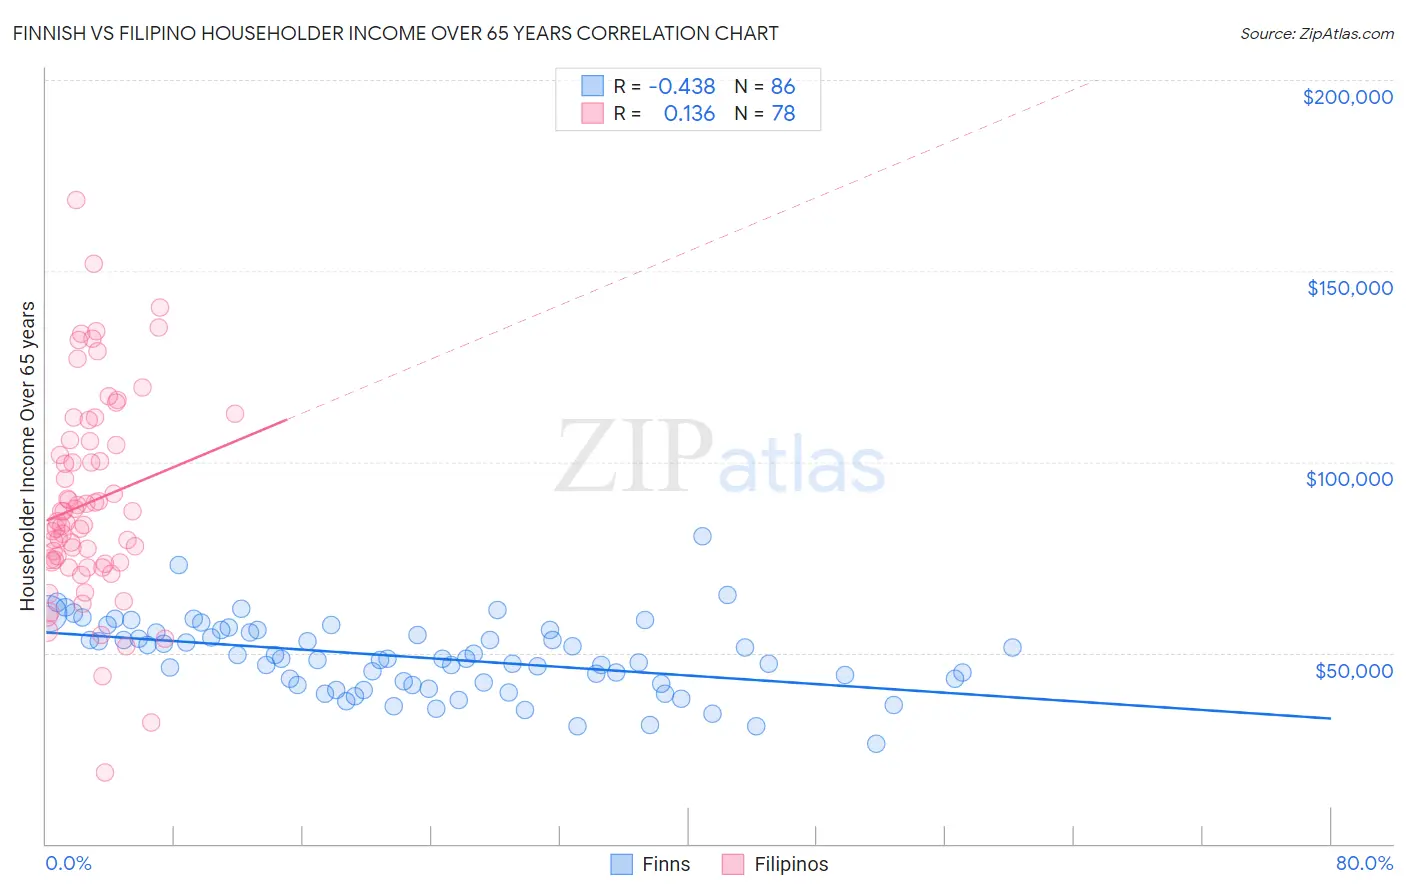
Finnish vs Filipino Householder Income Over 65 years Correlation Chart
The statistical analysis conducted on geographies consisting of 403,493,749 people shows a moderate negative correlation between the proportion of Finns and household income with householder over the age of 65 in the United States with a correlation coefficient (R) of -0.438 and weighted average of $59,535. Similarly, the statistical analysis conducted on geographies consisting of 253,664,228 people shows a poor positive correlation between the proportion of Filipinos and household income with householder over the age of 65 in the United States with a correlation coefficient (R) of 0.136 and weighted average of $76,686, a difference of 28.8%.
Householder Income Over 65 years Correlation Summary
| Measurement | Finnish | Filipino |
| Minimum | $26,250 | $18,667 |
| Maximum | $80,493 | $168,449 |
| Range | $54,243 | $149,782 |
| Mean | $48,855 | $89,373 |
| Median | $48,360 | $84,207 |
| Interquartile 25% (IQ1) | $41,947 | $73,750 |
| Interquartile 75% (IQ3) | $55,469 | $105,277 |
| Interquartile Range (IQR) | $13,523 | $31,527 |
| Standard Deviation (Sample) | $9,627 | $26,949 |
| Standard Deviation (Population) | $9,571 | $26,776 |
Similar Demographics by Householder Income Over 65 years
Demographics Similar to Finns by Householder Income Over 65 years
In terms of householder income over 65 years, the demographic groups most similar to Finns are Dutch ($59,539, a difference of 0.010%), Scotch-Irish ($59,447, a difference of 0.15%), Immigrants ($59,656, a difference of 0.20%), French ($59,656, a difference of 0.20%), and Moroccan ($59,683, a difference of 0.25%).
| Demographics | Rating | Rank | Householder Income Over 65 years |
| Immigrants | Iraq | 23.2 /100 | #195 | Fair $59,824 |
| Germans | 21.5 /100 | #196 | Fair $59,730 |
| Immigrants | Kenya | 21.1 /100 | #197 | Fair $59,710 |
| Moroccans | 20.7 /100 | #198 | Fair $59,683 |
| Immigrants | Immigrants | 20.2 /100 | #199 | Fair $59,656 |
| French | 20.2 /100 | #200 | Fair $59,656 |
| Dutch | 18.3 /100 | #201 | Poor $59,539 |
| Finns | 18.2 /100 | #202 | Poor $59,535 |
| Scotch-Irish | 16.9 /100 | #203 | Poor $59,447 |
| Arapaho | 16.0 /100 | #204 | Poor $59,383 |
| Immigrants | Sudan | 14.2 /100 | #205 | Poor $59,248 |
| Immigrants | South America | 13.0 /100 | #206 | Poor $59,151 |
| Salvadorans | 12.9 /100 | #207 | Poor $59,141 |
| Uruguayans | 12.3 /100 | #208 | Poor $59,090 |
| Slovaks | 11.7 /100 | #209 | Poor $59,039 |
Demographics Similar to Filipinos by Householder Income Over 65 years
In terms of householder income over 65 years, the demographic groups most similar to Filipinos are Immigrants from Taiwan ($77,051, a difference of 0.48%), Iranian ($77,429, a difference of 0.97%), Chinese ($77,465, a difference of 1.0%), Immigrants from Iran ($75,081, a difference of 2.1%), and Bolivian ($74,245, a difference of 3.3%).
| Demographics | Rating | Rank | Householder Income Over 65 years |
| Chinese | 100.0 /100 | #1 | Exceptional $77,465 |
| Iranians | 100.0 /100 | #2 | Exceptional $77,429 |
| Immigrants | Taiwan | 100.0 /100 | #3 | Exceptional $77,051 |
| Filipinos | 100.0 /100 | #4 | Exceptional $76,686 |
| Immigrants | Iran | 100.0 /100 | #5 | Exceptional $75,081 |
| Bolivians | 100.0 /100 | #6 | Exceptional $74,245 |
| Immigrants | Bolivia | 100.0 /100 | #7 | Exceptional $73,434 |
| Immigrants | Singapore | 100.0 /100 | #8 | Exceptional $72,963 |
| Immigrants | India | 100.0 /100 | #9 | Exceptional $72,804 |
| Bhutanese | 100.0 /100 | #10 | Exceptional $72,288 |
| Thais | 100.0 /100 | #11 | Exceptional $72,099 |
| Cypriots | 100.0 /100 | #12 | Exceptional $71,714 |
| Immigrants | Hong Kong | 100.0 /100 | #13 | Exceptional $71,567 |
| Burmese | 100.0 /100 | #14 | Exceptional $71,139 |
| Native Hawaiians | 100.0 /100 | #15 | Exceptional $71,021 |