Hopi vs Palestinian Median Household Income
COMPARE
Hopi
Palestinian
Median Household Income
Median Household Income Comparison
Hopi
Palestinians
$65,043
MEDIAN HOUSEHOLD INCOME
0.0/ 100
METRIC RATING
339th/ 347
METRIC RANK
$90,574
MEDIAN HOUSEHOLD INCOME
97.1/ 100
METRIC RATING
110th/ 347
METRIC RANK
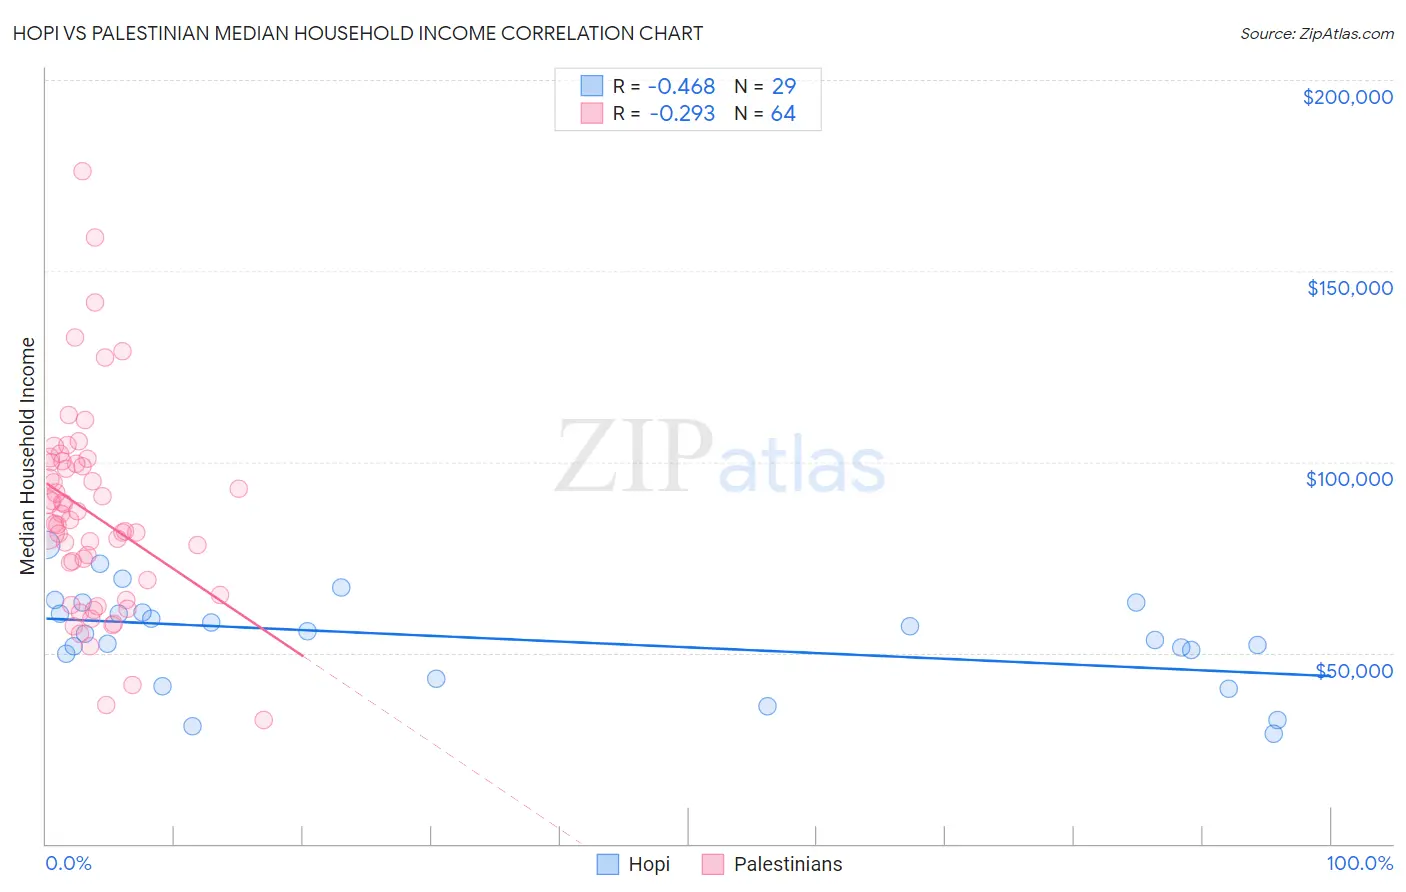
Hopi vs Palestinian Median Household Income Correlation Chart
The statistical analysis conducted on geographies consisting of 74,731,446 people shows a moderate negative correlation between the proportion of Hopi and median household income in the United States with a correlation coefficient (R) of -0.468 and weighted average of $65,043. Similarly, the statistical analysis conducted on geographies consisting of 216,355,198 people shows a weak negative correlation between the proportion of Palestinians and median household income in the United States with a correlation coefficient (R) of -0.293 and weighted average of $90,574, a difference of 39.3%.
Median Household Income Correlation Summary
| Measurement | Hopi | Palestinian |
| Minimum | $28,831 | $32,375 |
| Maximum | $78,310 | $176,058 |
| Range | $49,479 | $143,683 |
| Mean | $53,752 | $86,299 |
| Median | $55,122 | $84,304 |
| Interquartile 25% (IQ1) | $46,511 | $67,018 |
| Interquartile 75% (IQ3) | $61,881 | $99,711 |
| Interquartile Range (IQR) | $15,370 | $32,693 |
| Standard Deviation (Sample) | $12,388 | $26,509 |
| Standard Deviation (Population) | $12,173 | $26,301 |
Similar Demographics by Median Household Income
Demographics Similar to Hopi by Median Household Income
In terms of median household income, the demographic groups most similar to Hopi are Immigrants from Yemen ($65,194, a difference of 0.23%), Pueblo ($64,692, a difference of 0.54%), Kiowa ($65,914, a difference of 1.3%), Crow ($63,681, a difference of 2.1%), and Immigrants from Congo ($66,768, a difference of 2.6%).
| Demographics | Rating | Rank | Median Household Income |
| Sioux | 0.0 /100 | #332 | Tragic $67,792 |
| Creek | 0.0 /100 | #333 | Tragic $67,715 |
| Blacks/African Americans | 0.0 /100 | #334 | Tragic $67,573 |
| Cheyenne | 0.0 /100 | #335 | Tragic $66,974 |
| Immigrants | Congo | 0.0 /100 | #336 | Tragic $66,768 |
| Kiowa | 0.0 /100 | #337 | Tragic $65,914 |
| Immigrants | Yemen | 0.0 /100 | #338 | Tragic $65,194 |
| Hopi | 0.0 /100 | #339 | Tragic $65,043 |
| Pueblo | 0.0 /100 | #340 | Tragic $64,692 |
| Crow | 0.0 /100 | #341 | Tragic $63,681 |
| Pima | 0.0 /100 | #342 | Tragic $63,262 |
| Houma | 0.0 /100 | #343 | Tragic $62,575 |
| Tohono O'odham | 0.0 /100 | #344 | Tragic $61,663 |
| Puerto Ricans | 0.0 /100 | #345 | Tragic $59,197 |
| Navajo | 0.0 /100 | #346 | Tragic $59,159 |
Demographics Similar to Palestinians by Median Household Income
In terms of median household income, the demographic groups most similar to Palestinians are Chilean ($90,605, a difference of 0.030%), Immigrants from Poland ($90,549, a difference of 0.030%), Zimbabwean ($90,618, a difference of 0.050%), Croatian ($90,685, a difference of 0.12%), and Northern European ($90,446, a difference of 0.14%).
| Demographics | Rating | Rank | Median Household Income |
| Immigrants | Ukraine | 98.0 /100 | #103 | Exceptional $91,124 |
| Immigrants | Kazakhstan | 97.8 /100 | #104 | Exceptional $91,015 |
| Immigrants | Brazil | 97.7 /100 | #105 | Exceptional $90,907 |
| Macedonians | 97.4 /100 | #106 | Exceptional $90,761 |
| Croatians | 97.3 /100 | #107 | Exceptional $90,685 |
| Zimbabweans | 97.2 /100 | #108 | Exceptional $90,618 |
| Chileans | 97.2 /100 | #109 | Exceptional $90,605 |
| Palestinians | 97.1 /100 | #110 | Exceptional $90,574 |
| Immigrants | Poland | 97.1 /100 | #111 | Exceptional $90,549 |
| Northern Europeans | 96.9 /100 | #112 | Exceptional $90,446 |
| Peruvians | 96.5 /100 | #113 | Exceptional $90,261 |
| Immigrants | Northern Africa | 95.9 /100 | #114 | Exceptional $90,026 |
| Immigrants | Western Asia | 95.9 /100 | #115 | Exceptional $90,005 |
| Native Hawaiians | 95.7 /100 | #116 | Exceptional $89,919 |
| Taiwanese | 95.6 /100 | #117 | Exceptional $89,900 |