Hopi vs Spanish Median Household Income
COMPARE
Hopi
Spanish
Median Household Income
Median Household Income Comparison
Hopi
Spanish
$65,043
MEDIAN HOUSEHOLD INCOME
0.0/ 100
METRIC RATING
339th/ 347
METRIC RANK
$83,343
MEDIAN HOUSEHOLD INCOME
24.4/ 100
METRIC RATING
201st/ 347
METRIC RANK
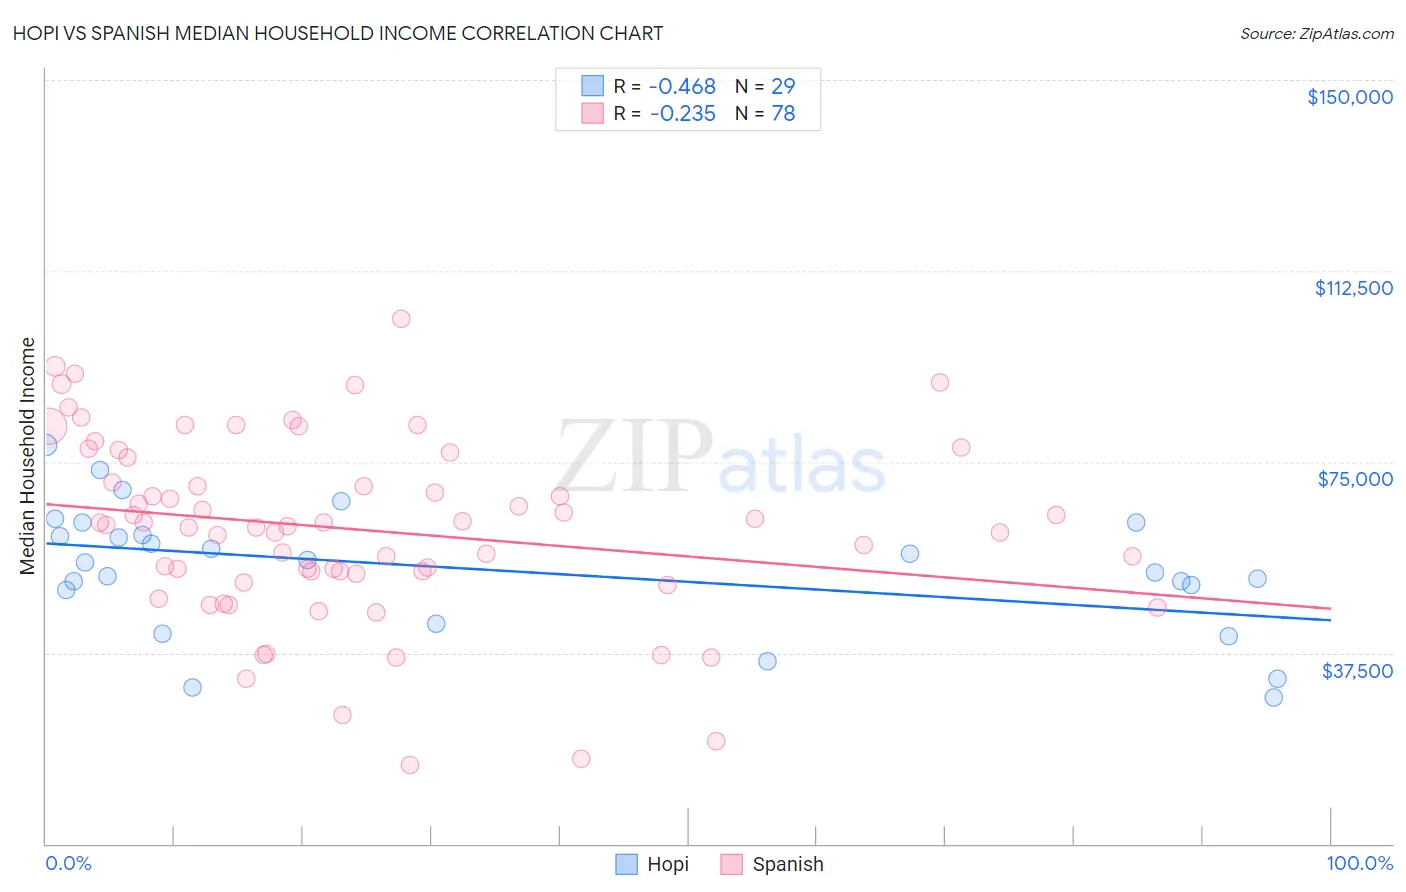
Hopi vs Spanish Median Household Income Correlation Chart
The statistical analysis conducted on geographies consisting of 74,731,446 people shows a moderate negative correlation between the proportion of Hopi and median household income in the United States with a correlation coefficient (R) of -0.468 and weighted average of $65,043. Similarly, the statistical analysis conducted on geographies consisting of 421,807,066 people shows a weak negative correlation between the proportion of Spanish and median household income in the United States with a correlation coefficient (R) of -0.235 and weighted average of $83,343, a difference of 28.1%.
Median Household Income Correlation Summary
| Measurement | Hopi | Spanish |
| Minimum | $28,831 | $15,577 |
| Maximum | $78,310 | $103,194 |
| Range | $49,479 | $87,617 |
| Mean | $53,752 | $61,640 |
| Median | $55,122 | $62,411 |
| Interquartile 25% (IQ1) | $46,511 | $53,047 |
| Interquartile 75% (IQ3) | $61,881 | $75,942 |
| Interquartile Range (IQR) | $15,370 | $22,895 |
| Standard Deviation (Sample) | $12,388 | $18,137 |
| Standard Deviation (Population) | $12,173 | $18,021 |
Similar Demographics by Median Household Income
Demographics Similar to Hopi by Median Household Income
In terms of median household income, the demographic groups most similar to Hopi are Immigrants from Yemen ($65,194, a difference of 0.23%), Pueblo ($64,692, a difference of 0.54%), Kiowa ($65,914, a difference of 1.3%), Crow ($63,681, a difference of 2.1%), and Immigrants from Congo ($66,768, a difference of 2.6%).
| Demographics | Rating | Rank | Median Household Income |
| Sioux | 0.0 /100 | #332 | Tragic $67,792 |
| Creek | 0.0 /100 | #333 | Tragic $67,715 |
| Blacks/African Americans | 0.0 /100 | #334 | Tragic $67,573 |
| Cheyenne | 0.0 /100 | #335 | Tragic $66,974 |
| Immigrants | Congo | 0.0 /100 | #336 | Tragic $66,768 |
| Kiowa | 0.0 /100 | #337 | Tragic $65,914 |
| Immigrants | Yemen | 0.0 /100 | #338 | Tragic $65,194 |
| Hopi | 0.0 /100 | #339 | Tragic $65,043 |
| Pueblo | 0.0 /100 | #340 | Tragic $64,692 |
| Crow | 0.0 /100 | #341 | Tragic $63,681 |
| Pima | 0.0 /100 | #342 | Tragic $63,262 |
| Houma | 0.0 /100 | #343 | Tragic $62,575 |
| Tohono O'odham | 0.0 /100 | #344 | Tragic $61,663 |
| Puerto Ricans | 0.0 /100 | #345 | Tragic $59,197 |
| Navajo | 0.0 /100 | #346 | Tragic $59,159 |
Demographics Similar to Spanish by Median Household Income
In terms of median household income, the demographic groups most similar to Spanish are Tsimshian ($83,346, a difference of 0.0%), German ($83,358, a difference of 0.020%), Immigrants from Thailand ($83,327, a difference of 0.020%), Immigrants from Cambodia ($83,304, a difference of 0.050%), and Japanese ($83,395, a difference of 0.060%).
| Demographics | Rating | Rank | Median Household Income |
| Ghanaians | 27.4 /100 | #194 | Fair $83,582 |
| Immigrants | Armenia | 27.0 /100 | #195 | Fair $83,555 |
| French | 26.0 /100 | #196 | Fair $83,468 |
| Aleuts | 25.7 /100 | #197 | Fair $83,446 |
| Japanese | 25.1 /100 | #198 | Fair $83,395 |
| Germans | 24.6 /100 | #199 | Fair $83,358 |
| Tsimshian | 24.5 /100 | #200 | Fair $83,346 |
| Spanish | 24.4 /100 | #201 | Fair $83,343 |
| Immigrants | Thailand | 24.3 /100 | #202 | Fair $83,327 |
| Immigrants | Cambodia | 24.0 /100 | #203 | Fair $83,304 |
| Immigrants | Africa | 23.8 /100 | #204 | Fair $83,289 |
| Celtics | 22.7 /100 | #205 | Fair $83,193 |
| Immigrants | Kenya | 21.3 /100 | #206 | Fair $83,068 |
| Dutch | 20.3 /100 | #207 | Fair $82,971 |
| French Canadians | 18.7 /100 | #208 | Poor $82,810 |