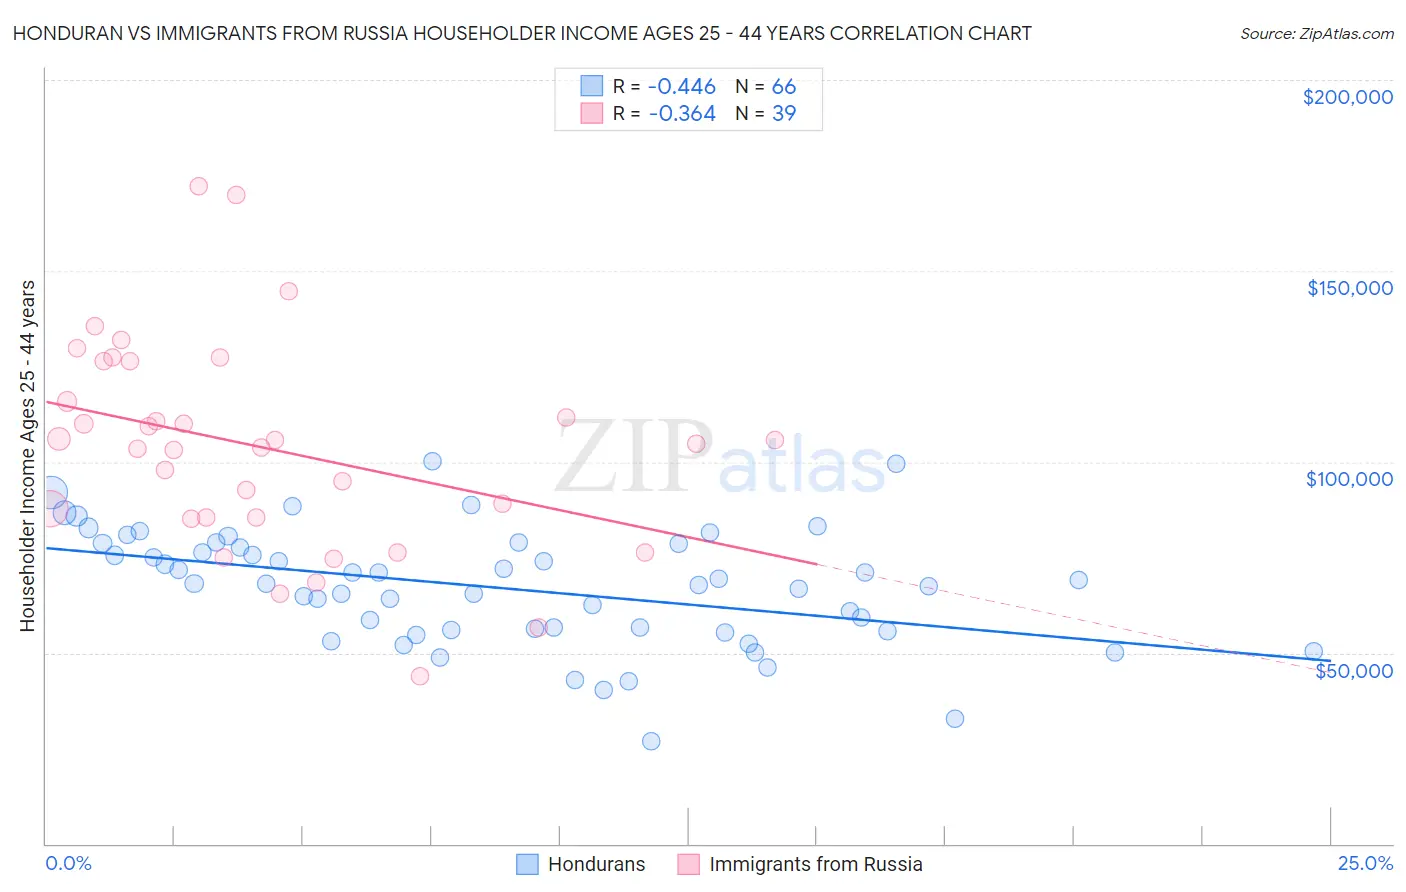
Honduran vs Immigrants from Russia Householder Income Ages 25 - 44 years
COMPARE
Honduran
Immigrants from Russia
Householder Income Ages 25 - 44 years
Householder Income Ages 25 - 44 years Comparison
Hondurans
Immigrants from Russia
$78,540
HOUSEHOLDER INCOME AGES 25 - 44 YEARS
0.0/ 100
METRIC RATING
319th/ 347
METRIC RANK
$108,751
HOUSEHOLDER INCOME AGES 25 - 44 YEARS
100.0/ 100
METRIC RATING
37th/ 347
METRIC RANK
Honduran vs Immigrants from Russia Householder Income Ages 25 - 44 years Correlation Chart
The statistical analysis conducted on geographies consisting of 357,079,818 people shows a moderate negative correlation between the proportion of Hondurans and household income with householder between the ages 25 and 44 in the United States with a correlation coefficient (R) of -0.446 and weighted average of $78,540. Similarly, the statistical analysis conducted on geographies consisting of 347,220,944 people shows a mild negative correlation between the proportion of Immigrants from Russia and household income with householder between the ages 25 and 44 in the United States with a correlation coefficient (R) of -0.364 and weighted average of $108,751, a difference of 38.5%.
Householder Income Ages 25 - 44 years Correlation Summary
| Measurement | Honduran | Immigrants from Russia |
| Minimum | $26,956 | $43,724 |
| Maximum | $100,173 | $172,064 |
| Range | $73,217 | $128,340 |
| Mean | $67,051 | $103,731 |
| Median | $68,041 | $104,773 |
| Interquartile 25% (IQ1) | $56,015 | $85,291 |
| Interquartile 75% (IQ3) | $78,438 | $126,225 |
| Interquartile Range (IQR) | $22,423 | $40,934 |
| Standard Deviation (Sample) | $15,191 | $27,697 |
| Standard Deviation (Population) | $15,075 | $27,339 |
Similar Demographics by Householder Income Ages 25 - 44 years
Demographics Similar to Hondurans by Householder Income Ages 25 - 44 years
In terms of householder income ages 25 - 44 years, the demographic groups most similar to Hondurans are Immigrants from Mexico ($78,809, a difference of 0.34%), U.S. Virgin Islander ($78,911, a difference of 0.47%), Choctaw ($78,168, a difference of 0.48%), African ($78,986, a difference of 0.57%), and Ottawa ($79,012, a difference of 0.60%).
| Demographics | Rating | Rank | Householder Income Ages 25 - 44 years |
| Immigrants | Haiti | 0.0 /100 | #312 | Tragic $79,391 |
| Menominee | 0.0 /100 | #313 | Tragic $79,358 |
| Cheyenne | 0.0 /100 | #314 | Tragic $79,152 |
| Ottawa | 0.0 /100 | #315 | Tragic $79,012 |
| Africans | 0.0 /100 | #316 | Tragic $78,986 |
| U.S. Virgin Islanders | 0.0 /100 | #317 | Tragic $78,911 |
| Immigrants | Mexico | 0.0 /100 | #318 | Tragic $78,809 |
| Hondurans | 0.0 /100 | #319 | Tragic $78,540 |
| Choctaw | 0.0 /100 | #320 | Tragic $78,168 |
| Immigrants | Zaire | 0.0 /100 | #321 | Tragic $78,045 |
| Chickasaw | 0.0 /100 | #322 | Tragic $77,929 |
| Immigrants | Honduras | 0.0 /100 | #323 | Tragic $77,328 |
| Dutch West Indians | 0.0 /100 | #324 | Tragic $77,260 |
| Sioux | 0.0 /100 | #325 | Tragic $77,089 |
| Houma | 0.0 /100 | #326 | Tragic $77,044 |
Demographics Similar to Immigrants from Russia by Householder Income Ages 25 - 44 years
In terms of householder income ages 25 - 44 years, the demographic groups most similar to Immigrants from Russia are Latvian ($108,926, a difference of 0.16%), Soviet Union ($108,457, a difference of 0.27%), Immigrants from Switzerland ($109,185, a difference of 0.40%), Immigrants from France ($108,257, a difference of 0.46%), and Immigrants from Lithuania ($108,149, a difference of 0.56%).
| Demographics | Rating | Rank | Householder Income Ages 25 - 44 years |
| Immigrants | Greece | 100.0 /100 | #30 | Exceptional $110,103 |
| Maltese | 100.0 /100 | #31 | Exceptional $110,064 |
| Immigrants | Sri Lanka | 100.0 /100 | #32 | Exceptional $109,741 |
| Bhutanese | 100.0 /100 | #33 | Exceptional $109,520 |
| Bolivians | 100.0 /100 | #34 | Exceptional $109,372 |
| Immigrants | Switzerland | 100.0 /100 | #35 | Exceptional $109,185 |
| Latvians | 100.0 /100 | #36 | Exceptional $108,926 |
| Immigrants | Russia | 100.0 /100 | #37 | Exceptional $108,751 |
| Soviet Union | 100.0 /100 | #38 | Exceptional $108,457 |
| Immigrants | France | 99.9 /100 | #39 | Exceptional $108,257 |
| Immigrants | Lithuania | 99.9 /100 | #40 | Exceptional $108,149 |
| Immigrants | Bolivia | 99.9 /100 | #41 | Exceptional $108,128 |
| Australians | 99.9 /100 | #42 | Exceptional $107,912 |
| Immigrants | Malaysia | 99.9 /100 | #43 | Exceptional $107,650 |
| Immigrants | Indonesia | 99.9 /100 | #44 | Exceptional $107,627 |