Cuban vs Immigrants from Vietnam Householder Income Ages 25 - 44 years
COMPARE
Cuban
Immigrants from Vietnam
Householder Income Ages 25 - 44 years
Householder Income Ages 25 - 44 years Comparison
Cubans
Immigrants from Vietnam
$81,483
HOUSEHOLDER INCOME AGES 25 - 44 YEARS
0.1/ 100
METRIC RATING
294th/ 347
METRIC RANK
$100,535
HOUSEHOLDER INCOME AGES 25 - 44 YEARS
96.5/ 100
METRIC RATING
105th/ 347
METRIC RANK
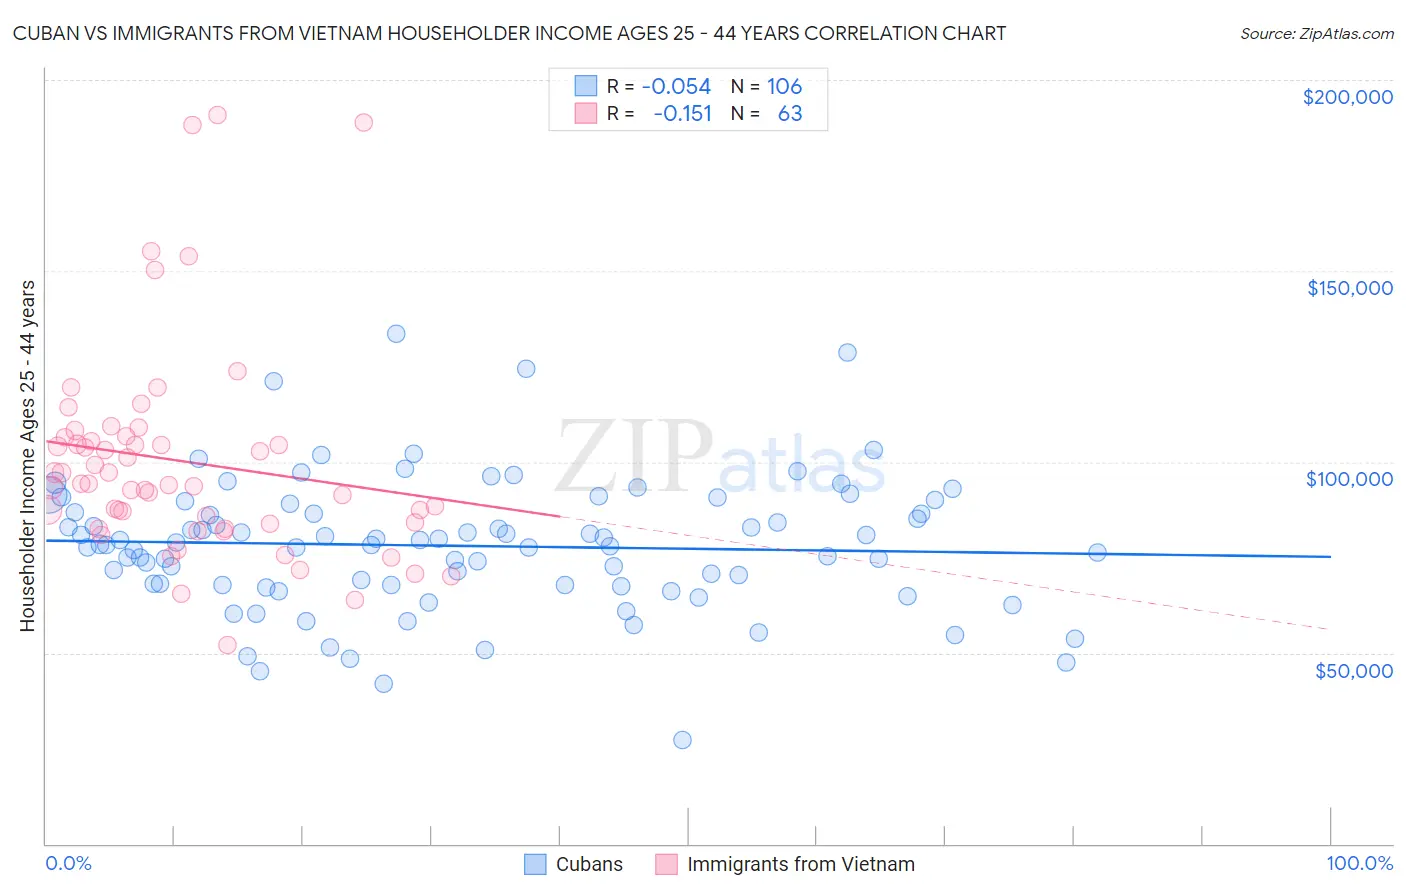
Cuban vs Immigrants from Vietnam Householder Income Ages 25 - 44 years Correlation Chart
The statistical analysis conducted on geographies consisting of 447,656,503 people shows a slight negative correlation between the proportion of Cubans and household income with householder between the ages 25 and 44 in the United States with a correlation coefficient (R) of -0.054 and weighted average of $81,483. Similarly, the statistical analysis conducted on geographies consisting of 403,588,460 people shows a poor negative correlation between the proportion of Immigrants from Vietnam and household income with householder between the ages 25 and 44 in the United States with a correlation coefficient (R) of -0.151 and weighted average of $100,535, a difference of 23.4%.
Householder Income Ages 25 - 44 years Correlation Summary
| Measurement | Cuban | Immigrants from Vietnam |
| Minimum | $27,125 | $51,884 |
| Maximum | $133,668 | $190,804 |
| Range | $106,543 | $138,920 |
| Mean | $78,016 | $100,184 |
| Median | $78,321 | $94,148 |
| Interquartile 25% (IQ1) | $67,806 | $83,833 |
| Interquartile 75% (IQ3) | $86,783 | $106,342 |
| Interquartile Range (IQR) | $18,977 | $22,509 |
| Standard Deviation (Sample) | $17,466 | $27,886 |
| Standard Deviation (Population) | $17,384 | $27,664 |
Similar Demographics by Householder Income Ages 25 - 44 years
Demographics Similar to Cubans by Householder Income Ages 25 - 44 years
In terms of householder income ages 25 - 44 years, the demographic groups most similar to Cubans are Blackfeet ($81,531, a difference of 0.060%), Bangladeshi ($81,363, a difference of 0.15%), Immigrants from Dominica ($81,351, a difference of 0.16%), Immigrants from Guatemala ($81,341, a difference of 0.17%), and Yaqui ($81,656, a difference of 0.21%).
| Demographics | Rating | Rank | Householder Income Ages 25 - 44 years |
| Immigrants | Latin America | 0.1 /100 | #287 | Tragic $82,166 |
| Comanche | 0.1 /100 | #288 | Tragic $82,152 |
| Shoshone | 0.1 /100 | #289 | Tragic $82,062 |
| Liberians | 0.1 /100 | #290 | Tragic $82,005 |
| Potawatomi | 0.1 /100 | #291 | Tragic $81,774 |
| Yaqui | 0.1 /100 | #292 | Tragic $81,656 |
| Blackfeet | 0.1 /100 | #293 | Tragic $81,531 |
| Cubans | 0.1 /100 | #294 | Tragic $81,483 |
| Bangladeshis | 0.1 /100 | #295 | Tragic $81,363 |
| Immigrants | Dominica | 0.1 /100 | #296 | Tragic $81,351 |
| Immigrants | Guatemala | 0.1 /100 | #297 | Tragic $81,341 |
| Dominicans | 0.1 /100 | #298 | Tragic $81,229 |
| Immigrants | Liberia | 0.1 /100 | #299 | Tragic $80,863 |
| Cherokee | 0.0 /100 | #300 | Tragic $80,843 |
| Immigrants | Micronesia | 0.0 /100 | #301 | Tragic $80,544 |
Demographics Similar to Immigrants from Vietnam by Householder Income Ages 25 - 44 years
In terms of householder income ages 25 - 44 years, the demographic groups most similar to Immigrants from Vietnam are Immigrants from Brazil ($100,534, a difference of 0.0%), Northern European ($100,457, a difference of 0.080%), Immigrants from South Eastern Asia ($100,283, a difference of 0.25%), Immigrants from North Macedonia ($100,101, a difference of 0.43%), and Immigrants from Poland ($101,065, a difference of 0.53%).
| Demographics | Rating | Rank | Householder Income Ages 25 - 44 years |
| Immigrants | Kazakhstan | 98.1 /100 | #98 | Exceptional $101,727 |
| Taiwanese | 97.9 /100 | #99 | Exceptional $101,492 |
| Immigrants | Argentina | 97.8 /100 | #100 | Exceptional $101,415 |
| Albanians | 97.8 /100 | #101 | Exceptional $101,367 |
| Immigrants | Lebanon | 97.4 /100 | #102 | Exceptional $101,124 |
| Immigrants | Moldova | 97.4 /100 | #103 | Exceptional $101,091 |
| Immigrants | Poland | 97.4 /100 | #104 | Exceptional $101,065 |
| Immigrants | Vietnam | 96.5 /100 | #105 | Exceptional $100,535 |
| Immigrants | Brazil | 96.5 /100 | #106 | Exceptional $100,534 |
| Northern Europeans | 96.3 /100 | #107 | Exceptional $100,457 |
| Immigrants | South Eastern Asia | 96.0 /100 | #108 | Exceptional $100,283 |
| Immigrants | North Macedonia | 95.6 /100 | #109 | Exceptional $100,101 |
| Immigrants | Afghanistan | 95.3 /100 | #110 | Exceptional $99,977 |
| Chileans | 95.1 /100 | #111 | Exceptional $99,900 |
| Poles | 94.5 /100 | #112 | Exceptional $99,685 |