Honduran vs Sudanese Householder Income Ages 25 - 44 years
COMPARE
Honduran
Sudanese
Householder Income Ages 25 - 44 years
Householder Income Ages 25 - 44 years Comparison
Hondurans
Sudanese
$78,540
HOUSEHOLDER INCOME AGES 25 - 44 YEARS
0.0/ 100
METRIC RATING
319th/ 347
METRIC RANK
$84,401
HOUSEHOLDER INCOME AGES 25 - 44 YEARS
0.4/ 100
METRIC RATING
265th/ 347
METRIC RANK
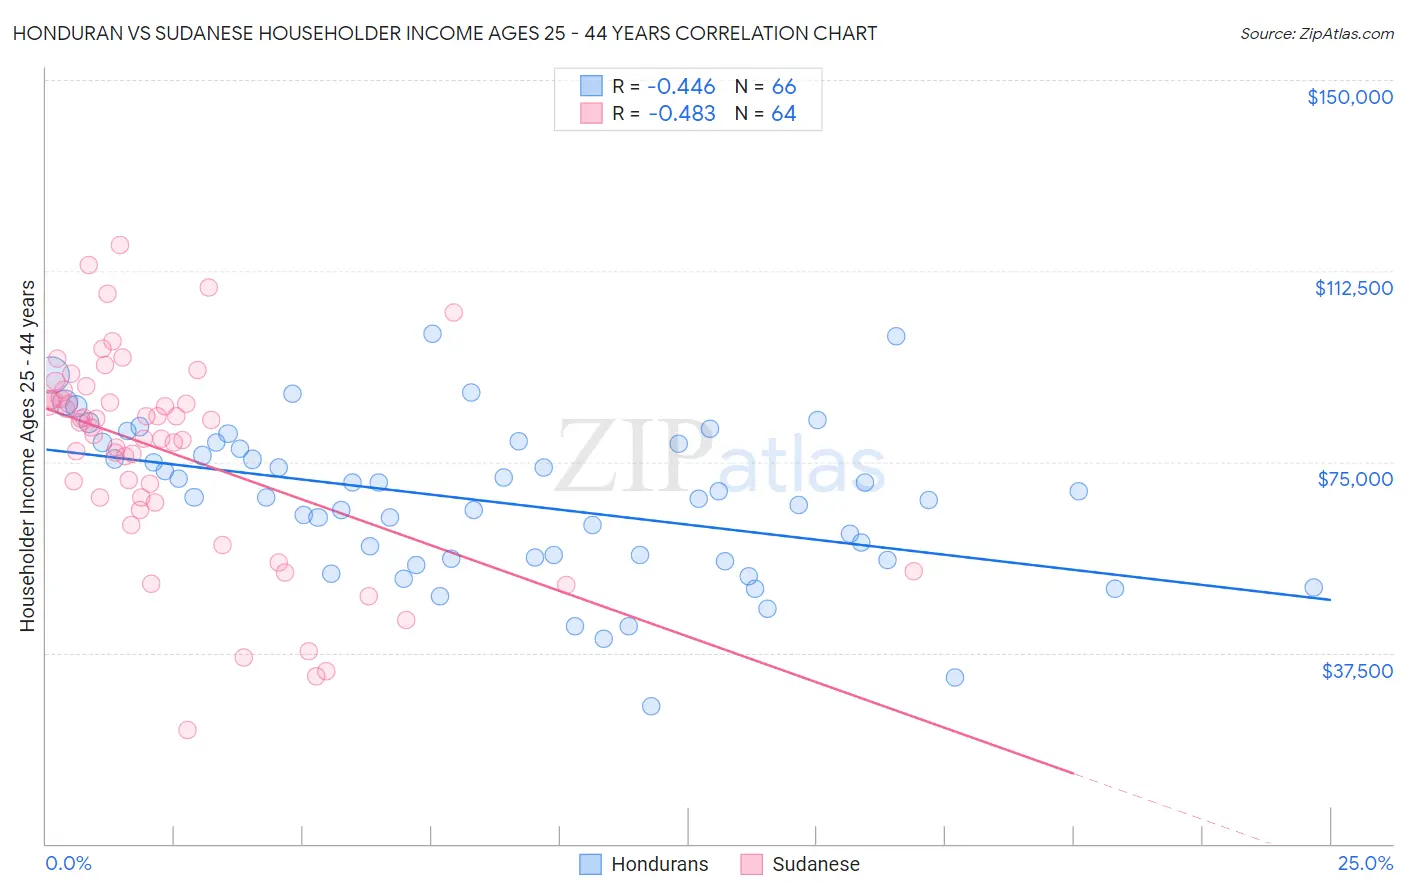
Honduran vs Sudanese Householder Income Ages 25 - 44 years Correlation Chart
The statistical analysis conducted on geographies consisting of 357,079,818 people shows a moderate negative correlation between the proportion of Hondurans and household income with householder between the ages 25 and 44 in the United States with a correlation coefficient (R) of -0.446 and weighted average of $78,540. Similarly, the statistical analysis conducted on geographies consisting of 110,044,809 people shows a moderate negative correlation between the proportion of Sudanese and household income with householder between the ages 25 and 44 in the United States with a correlation coefficient (R) of -0.483 and weighted average of $84,401, a difference of 7.5%.
Householder Income Ages 25 - 44 years Correlation Summary
| Measurement | Honduran | Sudanese |
| Minimum | $26,956 | $22,303 |
| Maximum | $100,173 | $117,632 |
| Range | $73,217 | $95,330 |
| Mean | $67,051 | $76,942 |
| Median | $68,041 | $82,204 |
| Interquartile 25% (IQ1) | $56,015 | $67,535 |
| Interquartile 75% (IQ3) | $78,438 | $87,340 |
| Interquartile Range (IQR) | $22,423 | $19,805 |
| Standard Deviation (Sample) | $15,191 | $20,185 |
| Standard Deviation (Population) | $15,075 | $20,027 |
Similar Demographics by Householder Income Ages 25 - 44 years
Demographics Similar to Hondurans by Householder Income Ages 25 - 44 years
In terms of householder income ages 25 - 44 years, the demographic groups most similar to Hondurans are Immigrants from Mexico ($78,809, a difference of 0.34%), U.S. Virgin Islander ($78,911, a difference of 0.47%), Choctaw ($78,168, a difference of 0.48%), African ($78,986, a difference of 0.57%), and Ottawa ($79,012, a difference of 0.60%).
| Demographics | Rating | Rank | Householder Income Ages 25 - 44 years |
| Immigrants | Haiti | 0.0 /100 | #312 | Tragic $79,391 |
| Menominee | 0.0 /100 | #313 | Tragic $79,358 |
| Cheyenne | 0.0 /100 | #314 | Tragic $79,152 |
| Ottawa | 0.0 /100 | #315 | Tragic $79,012 |
| Africans | 0.0 /100 | #316 | Tragic $78,986 |
| U.S. Virgin Islanders | 0.0 /100 | #317 | Tragic $78,911 |
| Immigrants | Mexico | 0.0 /100 | #318 | Tragic $78,809 |
| Hondurans | 0.0 /100 | #319 | Tragic $78,540 |
| Choctaw | 0.0 /100 | #320 | Tragic $78,168 |
| Immigrants | Zaire | 0.0 /100 | #321 | Tragic $78,045 |
| Chickasaw | 0.0 /100 | #322 | Tragic $77,929 |
| Immigrants | Honduras | 0.0 /100 | #323 | Tragic $77,328 |
| Dutch West Indians | 0.0 /100 | #324 | Tragic $77,260 |
| Sioux | 0.0 /100 | #325 | Tragic $77,089 |
| Houma | 0.0 /100 | #326 | Tragic $77,044 |
Demographics Similar to Sudanese by Householder Income Ages 25 - 44 years
In terms of householder income ages 25 - 44 years, the demographic groups most similar to Sudanese are Osage ($84,461, a difference of 0.070%), Immigrants from Cabo Verde ($84,304, a difference of 0.12%), Belizean ($84,534, a difference of 0.16%), Hmong ($84,258, a difference of 0.17%), and Cree ($84,574, a difference of 0.20%).
| Demographics | Rating | Rank | Householder Income Ages 25 - 44 years |
| Immigrants | Nicaragua | 0.5 /100 | #258 | Tragic $84,914 |
| Immigrants | Senegal | 0.5 /100 | #259 | Tragic $84,848 |
| Americans | 0.4 /100 | #260 | Tragic $84,791 |
| Inupiat | 0.4 /100 | #261 | Tragic $84,619 |
| Cree | 0.4 /100 | #262 | Tragic $84,574 |
| Belizeans | 0.4 /100 | #263 | Tragic $84,534 |
| Osage | 0.4 /100 | #264 | Tragic $84,461 |
| Sudanese | 0.4 /100 | #265 | Tragic $84,401 |
| Immigrants | Cabo Verde | 0.3 /100 | #266 | Tragic $84,304 |
| Hmong | 0.3 /100 | #267 | Tragic $84,258 |
| Sub-Saharan Africans | 0.3 /100 | #268 | Tragic $84,235 |
| Spanish American Indians | 0.3 /100 | #269 | Tragic $84,085 |
| Jamaicans | 0.3 /100 | #270 | Tragic $83,933 |
| Somalis | 0.2 /100 | #271 | Tragic $83,752 |
| Spanish Americans | 0.2 /100 | #272 | Tragic $83,722 |