Honduran vs Guyanese Householder Income Ages 25 - 44 years
COMPARE
Honduran
Guyanese
Householder Income Ages 25 - 44 years
Householder Income Ages 25 - 44 years Comparison
Hondurans
Guyanese
$78,540
HOUSEHOLDER INCOME AGES 25 - 44 YEARS
0.0/ 100
METRIC RATING
319th/ 347
METRIC RANK
$89,940
HOUSEHOLDER INCOME AGES 25 - 44 YEARS
7.1/ 100
METRIC RATING
218th/ 347
METRIC RANK
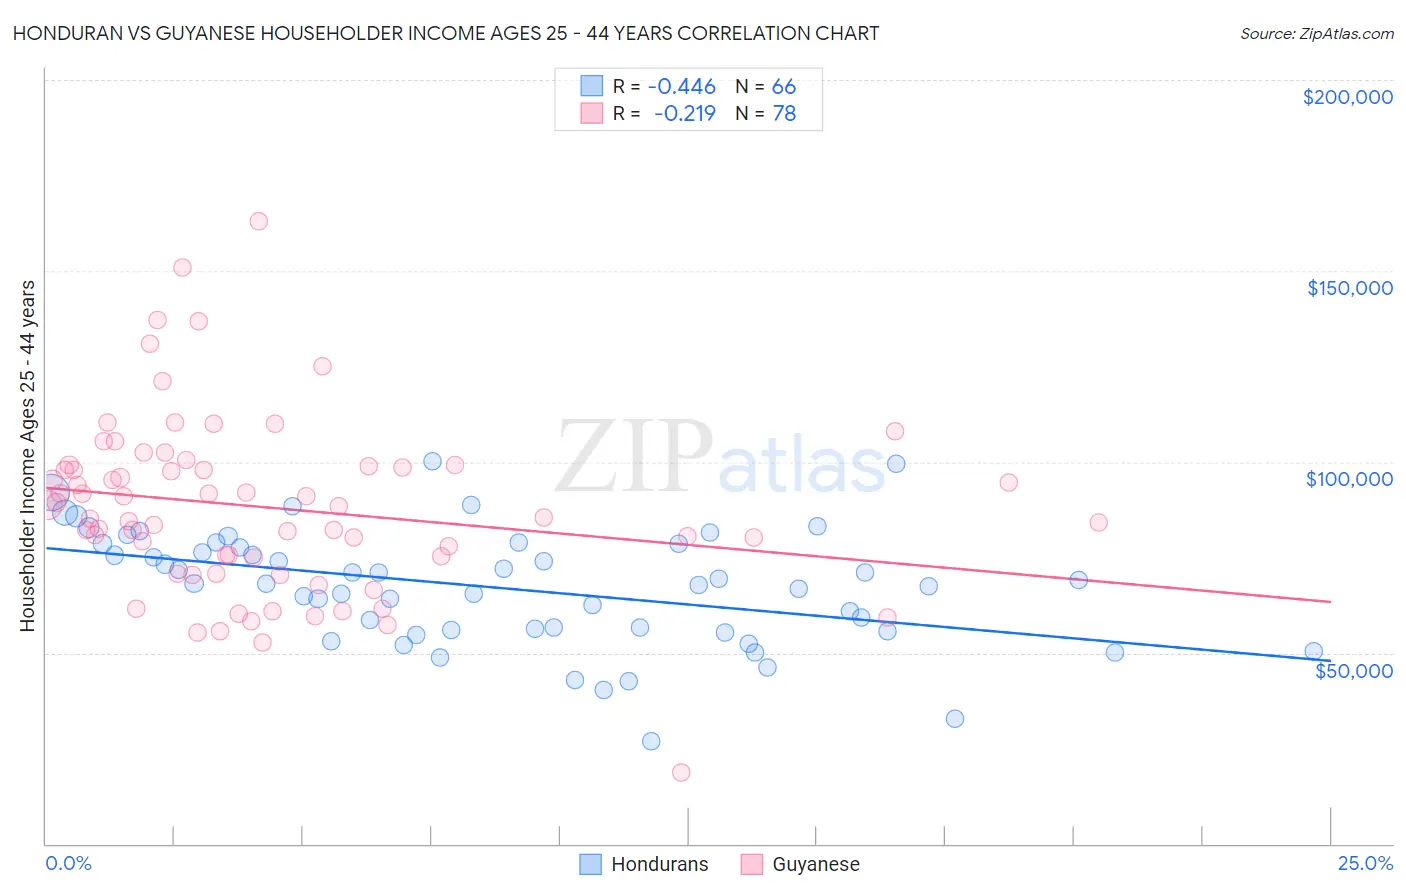
Honduran vs Guyanese Householder Income Ages 25 - 44 years Correlation Chart
The statistical analysis conducted on geographies consisting of 357,079,818 people shows a moderate negative correlation between the proportion of Hondurans and household income with householder between the ages 25 and 44 in the United States with a correlation coefficient (R) of -0.446 and weighted average of $78,540. Similarly, the statistical analysis conducted on geographies consisting of 176,637,436 people shows a weak negative correlation between the proportion of Guyanese and household income with householder between the ages 25 and 44 in the United States with a correlation coefficient (R) of -0.219 and weighted average of $89,940, a difference of 14.5%.
Householder Income Ages 25 - 44 years Correlation Summary
| Measurement | Honduran | Guyanese |
| Minimum | $26,956 | $18,657 |
| Maximum | $100,173 | $163,166 |
| Range | $73,217 | $144,509 |
| Mean | $67,051 | $87,951 |
| Median | $68,041 | $86,958 |
| Interquartile 25% (IQ1) | $56,015 | $75,027 |
| Interquartile 75% (IQ3) | $78,438 | $98,879 |
| Interquartile Range (IQR) | $22,423 | $23,852 |
| Standard Deviation (Sample) | $15,191 | $23,398 |
| Standard Deviation (Population) | $15,075 | $23,248 |
Similar Demographics by Householder Income Ages 25 - 44 years
Demographics Similar to Hondurans by Householder Income Ages 25 - 44 years
In terms of householder income ages 25 - 44 years, the demographic groups most similar to Hondurans are Immigrants from Mexico ($78,809, a difference of 0.34%), U.S. Virgin Islander ($78,911, a difference of 0.47%), Choctaw ($78,168, a difference of 0.48%), African ($78,986, a difference of 0.57%), and Ottawa ($79,012, a difference of 0.60%).
| Demographics | Rating | Rank | Householder Income Ages 25 - 44 years |
| Immigrants | Haiti | 0.0 /100 | #312 | Tragic $79,391 |
| Menominee | 0.0 /100 | #313 | Tragic $79,358 |
| Cheyenne | 0.0 /100 | #314 | Tragic $79,152 |
| Ottawa | 0.0 /100 | #315 | Tragic $79,012 |
| Africans | 0.0 /100 | #316 | Tragic $78,986 |
| U.S. Virgin Islanders | 0.0 /100 | #317 | Tragic $78,911 |
| Immigrants | Mexico | 0.0 /100 | #318 | Tragic $78,809 |
| Hondurans | 0.0 /100 | #319 | Tragic $78,540 |
| Choctaw | 0.0 /100 | #320 | Tragic $78,168 |
| Immigrants | Zaire | 0.0 /100 | #321 | Tragic $78,045 |
| Chickasaw | 0.0 /100 | #322 | Tragic $77,929 |
| Immigrants | Honduras | 0.0 /100 | #323 | Tragic $77,328 |
| Dutch West Indians | 0.0 /100 | #324 | Tragic $77,260 |
| Sioux | 0.0 /100 | #325 | Tragic $77,089 |
| Houma | 0.0 /100 | #326 | Tragic $77,044 |
Demographics Similar to Guyanese by Householder Income Ages 25 - 44 years
In terms of householder income ages 25 - 44 years, the demographic groups most similar to Guyanese are Scotch-Irish ($89,969, a difference of 0.030%), Delaware ($89,876, a difference of 0.070%), Trinidadian and Tobagonian ($89,856, a difference of 0.090%), Immigrants from Trinidad and Tobago ($89,748, a difference of 0.21%), and Ghanaian ($90,137, a difference of 0.22%).
| Demographics | Rating | Rank | Householder Income Ages 25 - 44 years |
| Iraqis | 10.8 /100 | #211 | Poor $90,764 |
| Hawaiians | 10.6 /100 | #212 | Poor $90,722 |
| Immigrants | Bangladesh | 9.3 /100 | #213 | Tragic $90,448 |
| Immigrants | Africa | 8.9 /100 | #214 | Tragic $90,372 |
| Panamanians | 8.1 /100 | #215 | Tragic $90,193 |
| Ghanaians | 7.9 /100 | #216 | Tragic $90,137 |
| Scotch-Irish | 7.3 /100 | #217 | Tragic $89,969 |
| Guyanese | 7.1 /100 | #218 | Tragic $89,940 |
| Delaware | 6.9 /100 | #219 | Tragic $89,876 |
| Trinidadians and Tobagonians | 6.8 /100 | #220 | Tragic $89,856 |
| Immigrants | Trinidad and Tobago | 6.5 /100 | #221 | Tragic $89,748 |
| Immigrants | Ecuador | 6.2 /100 | #222 | Tragic $89,673 |
| Immigrants | Guyana | 5.9 /100 | #223 | Tragic $89,586 |
| Barbadians | 5.9 /100 | #224 | Tragic $89,565 |
| Immigrants | Panama | 5.5 /100 | #225 | Tragic $89,451 |