Honduran vs Spanish American Indian Per Capita Income
COMPARE
Honduran
Spanish American Indian
Per Capita Income
Per Capita Income Comparison
Hondurans
Spanish American Indians
$37,031
PER CAPITA INCOME
0.1/ 100
METRIC RATING
304th/ 347
METRIC RANK
$34,195
PER CAPITA INCOME
0.0/ 100
METRIC RATING
330th/ 347
METRIC RANK
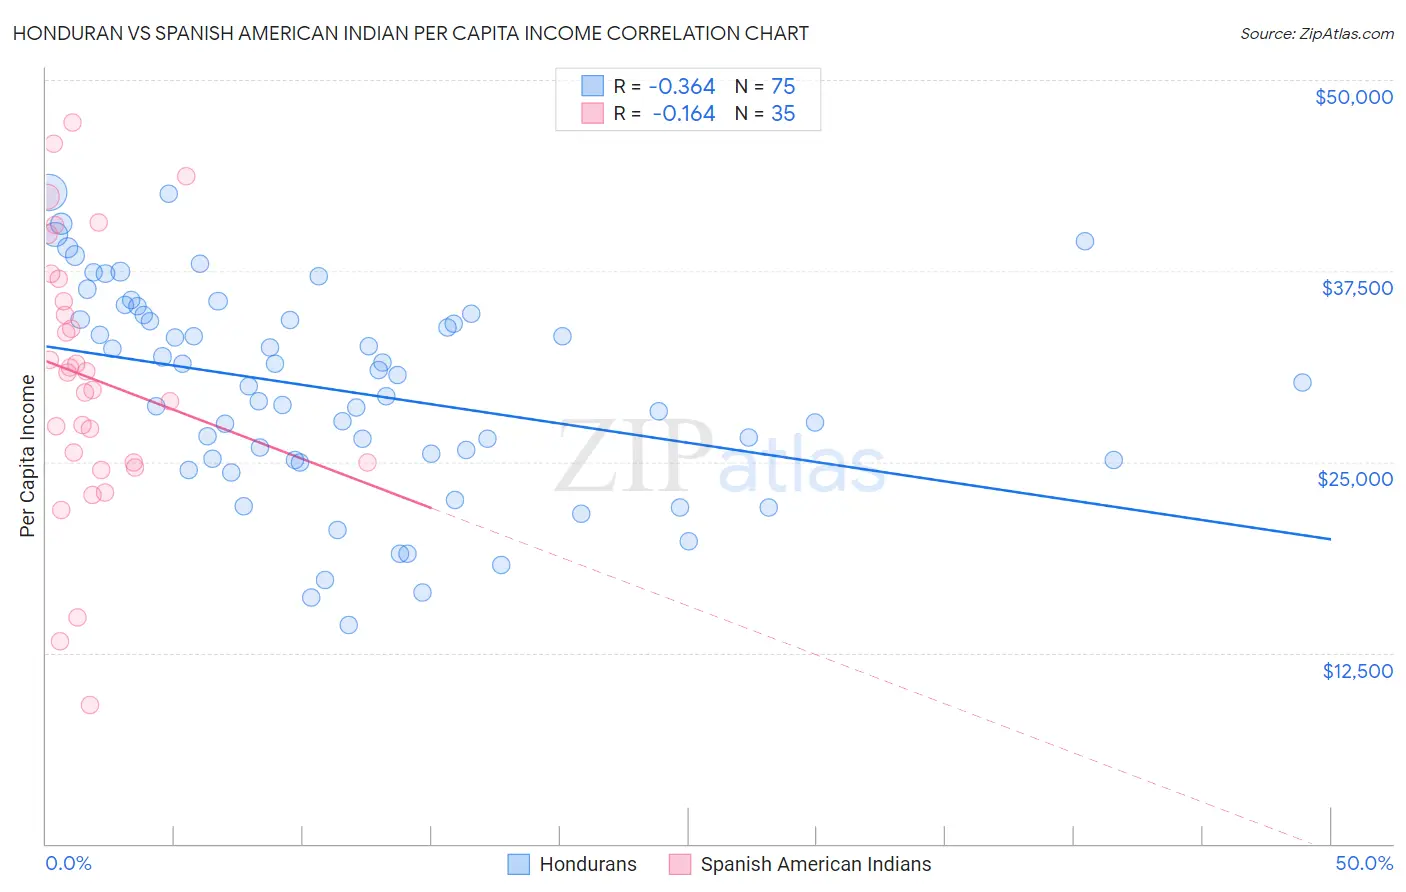
Honduran vs Spanish American Indian Per Capita Income Correlation Chart
The statistical analysis conducted on geographies consisting of 357,835,074 people shows a mild negative correlation between the proportion of Hondurans and per capita income in the United States with a correlation coefficient (R) of -0.364 and weighted average of $37,031. Similarly, the statistical analysis conducted on geographies consisting of 73,150,359 people shows a poor negative correlation between the proportion of Spanish American Indians and per capita income in the United States with a correlation coefficient (R) of -0.164 and weighted average of $34,195, a difference of 8.3%.
Per Capita Income Correlation Summary
| Measurement | Honduran | Spanish American Indian |
| Minimum | $14,358 | $9,061 |
| Maximum | $42,674 | $47,199 |
| Range | $28,316 | $38,138 |
| Mean | $29,671 | $30,495 |
| Median | $30,191 | $30,854 |
| Interquartile 25% (IQ1) | $25,099 | $24,953 |
| Interquartile 75% (IQ3) | $34,632 | $37,015 |
| Interquartile Range (IQR) | $9,533 | $12,062 |
| Standard Deviation (Sample) | $6,736 | $8,840 |
| Standard Deviation (Population) | $6,690 | $8,713 |
Similar Demographics by Per Capita Income
Demographics Similar to Hondurans by Per Capita Income
In terms of per capita income, the demographic groups most similar to Hondurans are Inupiat ($36,999, a difference of 0.080%), Paiute ($37,066, a difference of 0.090%), Shoshone ($37,072, a difference of 0.11%), Ottawa ($37,101, a difference of 0.19%), and Immigrants from Bahamas ($37,193, a difference of 0.44%).
| Demographics | Rating | Rank | Per Capita Income |
| Haitians | 0.1 /100 | #297 | Tragic $37,289 |
| Immigrants | Caribbean | 0.1 /100 | #298 | Tragic $37,254 |
| Cherokee | 0.1 /100 | #299 | Tragic $37,203 |
| Immigrants | Bahamas | 0.1 /100 | #300 | Tragic $37,193 |
| Ottawa | 0.1 /100 | #301 | Tragic $37,101 |
| Shoshone | 0.1 /100 | #302 | Tragic $37,072 |
| Paiute | 0.1 /100 | #303 | Tragic $37,066 |
| Hondurans | 0.1 /100 | #304 | Tragic $37,031 |
| Inupiat | 0.1 /100 | #305 | Tragic $36,999 |
| Immigrants | Haiti | 0.0 /100 | #306 | Tragic $36,849 |
| Immigrants | Latin America | 0.0 /100 | #307 | Tragic $36,823 |
| Fijians | 0.0 /100 | #308 | Tragic $36,690 |
| Immigrants | Honduras | 0.0 /100 | #309 | Tragic $36,665 |
| Ute | 0.0 /100 | #310 | Tragic $36,651 |
| Chippewa | 0.0 /100 | #311 | Tragic $36,631 |
Demographics Similar to Spanish American Indians by Per Capita Income
In terms of per capita income, the demographic groups most similar to Spanish American Indians are Immigrants from Mexico ($33,931, a difference of 0.78%), Sioux ($33,921, a difference of 0.81%), Mexican ($34,559, a difference of 1.1%), Menominee ($34,578, a difference of 1.1%), and Immigrants from Yemen ($33,696, a difference of 1.5%).
| Demographics | Rating | Rank | Per Capita Income |
| Cheyenne | 0.0 /100 | #323 | Tragic $35,276 |
| Kiowa | 0.0 /100 | #324 | Tragic $35,102 |
| Immigrants | Central America | 0.0 /100 | #325 | Tragic $34,974 |
| Immigrants | Cuba | 0.0 /100 | #326 | Tragic $34,910 |
| Apache | 0.0 /100 | #327 | Tragic $34,886 |
| Menominee | 0.0 /100 | #328 | Tragic $34,578 |
| Mexicans | 0.0 /100 | #329 | Tragic $34,559 |
| Spanish American Indians | 0.0 /100 | #330 | Tragic $34,195 |
| Immigrants | Mexico | 0.0 /100 | #331 | Tragic $33,931 |
| Sioux | 0.0 /100 | #332 | Tragic $33,921 |
| Immigrants | Yemen | 0.0 /100 | #333 | Tragic $33,696 |
| Natives/Alaskans | 0.0 /100 | #334 | Tragic $33,279 |
| Yuman | 0.0 /100 | #335 | Tragic $33,236 |
| Yakama | 0.0 /100 | #336 | Tragic $33,009 |
| Houma | 0.0 /100 | #337 | Tragic $32,996 |