Immigrants from Middle Africa vs Venezuelan Per Capita Income
COMPARE
Immigrants from Middle Africa
Venezuelan
Per Capita Income
Per Capita Income Comparison
Immigrants from Middle Africa
Venezuelans
$39,529
PER CAPITA INCOME
1.0/ 100
METRIC RATING
255th/ 347
METRIC RANK
$42,074
PER CAPITA INCOME
14.4/ 100
METRIC RATING
207th/ 347
METRIC RANK
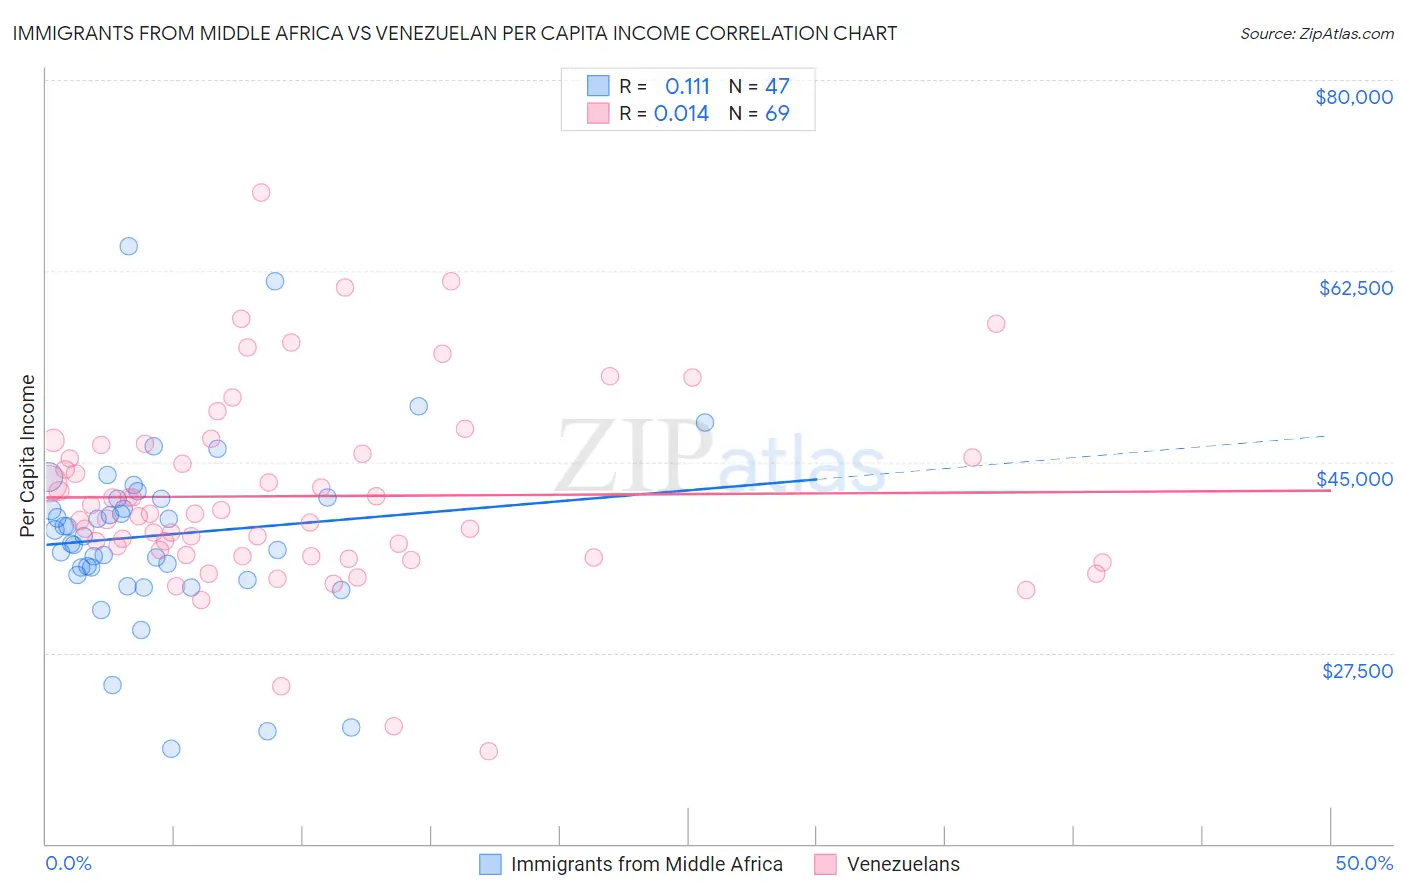
Immigrants from Middle Africa vs Venezuelan Per Capita Income Correlation Chart
The statistical analysis conducted on geographies consisting of 202,748,114 people shows a poor positive correlation between the proportion of Immigrants from Middle Africa and per capita income in the United States with a correlation coefficient (R) of 0.111 and weighted average of $39,529. Similarly, the statistical analysis conducted on geographies consisting of 306,315,613 people shows no correlation between the proportion of Venezuelans and per capita income in the United States with a correlation coefficient (R) of 0.014 and weighted average of $42,074, a difference of 6.4%.
Per Capita Income Correlation Summary
| Measurement | Immigrants from Middle Africa | Venezuelan |
| Minimum | $18,741 | $18,497 |
| Maximum | $64,792 | $69,728 |
| Range | $46,051 | $51,231 |
| Mean | $38,268 | $41,856 |
| Median | $38,152 | $40,215 |
| Interquartile 25% (IQ1) | $34,623 | $36,400 |
| Interquartile 75% (IQ3) | $41,622 | $46,139 |
| Interquartile Range (IQR) | $6,999 | $9,740 |
| Standard Deviation (Sample) | $8,450 | $8,927 |
| Standard Deviation (Population) | $8,360 | $8,862 |
Similar Demographics by Per Capita Income
Demographics Similar to Immigrants from Middle Africa by Per Capita Income
In terms of per capita income, the demographic groups most similar to Immigrants from Middle Africa are Alaska Native ($39,558, a difference of 0.070%), Osage ($39,568, a difference of 0.10%), Immigrants from the Azores ($39,608, a difference of 0.20%), Hawaiian ($39,403, a difference of 0.32%), and Nicaraguan ($39,372, a difference of 0.40%).
| Demographics | Rating | Rank | Per Capita Income |
| Cape Verdeans | 1.5 /100 | #248 | Tragic $39,935 |
| Japanese | 1.4 /100 | #249 | Tragic $39,870 |
| Immigrants | Burma/Myanmar | 1.3 /100 | #250 | Tragic $39,827 |
| Samoans | 1.3 /100 | #251 | Tragic $39,826 |
| Immigrants | Azores | 1.0 /100 | #252 | Tragic $39,608 |
| Osage | 1.0 /100 | #253 | Tragic $39,568 |
| Alaska Natives | 1.0 /100 | #254 | Tragic $39,558 |
| Immigrants | Middle Africa | 1.0 /100 | #255 | Tragic $39,529 |
| Hawaiians | 0.8 /100 | #256 | Tragic $39,403 |
| Nicaraguans | 0.8 /100 | #257 | Tragic $39,372 |
| Jamaicans | 0.7 /100 | #258 | Tragic $39,231 |
| Malaysians | 0.7 /100 | #259 | Tragic $39,194 |
| Alaskan Athabascans | 0.6 /100 | #260 | Tragic $39,163 |
| Marshallese | 0.6 /100 | #261 | Tragic $39,108 |
| Iroquois | 0.6 /100 | #262 | Tragic $39,104 |
Demographics Similar to Venezuelans by Per Capita Income
In terms of per capita income, the demographic groups most similar to Venezuelans are Panamanian ($42,035, a difference of 0.090%), Ghanaian ($42,164, a difference of 0.21%), Immigrants from Sudan ($41,986, a difference of 0.21%), White/Caucasian ($42,180, a difference of 0.25%), and Ecuadorian ($41,958, a difference of 0.28%).
| Demographics | Rating | Rank | Per Capita Income |
| Vietnamese | 19.0 /100 | #200 | Poor $42,368 |
| Immigrants | Thailand | 17.6 /100 | #201 | Poor $42,289 |
| Immigrants | Bosnia and Herzegovina | 17.5 /100 | #202 | Poor $42,278 |
| Spanish | 17.0 /100 | #203 | Poor $42,249 |
| Aleuts | 16.4 /100 | #204 | Poor $42,210 |
| Whites/Caucasians | 15.9 /100 | #205 | Poor $42,180 |
| Ghanaians | 15.7 /100 | #206 | Poor $42,164 |
| Venezuelans | 14.4 /100 | #207 | Poor $42,074 |
| Panamanians | 13.9 /100 | #208 | Poor $42,035 |
| Immigrants | Sudan | 13.2 /100 | #209 | Poor $41,986 |
| Ecuadorians | 12.9 /100 | #210 | Poor $41,958 |
| Immigrants | Panama | 11.6 /100 | #211 | Poor $41,853 |
| Immigrants | Senegal | 11.3 /100 | #212 | Poor $41,830 |
| Immigrants | Venezuela | 10.2 /100 | #213 | Poor $41,727 |
| Immigrants | Bangladesh | 10.1 /100 | #214 | Poor $41,709 |