Hmong vs Immigrants from Bangladesh Median Family Income
COMPARE
Hmong
Immigrants from Bangladesh
Median Family Income
Median Family Income Comparison
Hmong
Immigrants from Bangladesh
$91,296
MEDIAN FAMILY INCOME
0.3/ 100
METRIC RATING
265th/ 347
METRIC RANK
$94,665
MEDIAN FAMILY INCOME
1.6/ 100
METRIC RATING
233rd/ 347
METRIC RANK
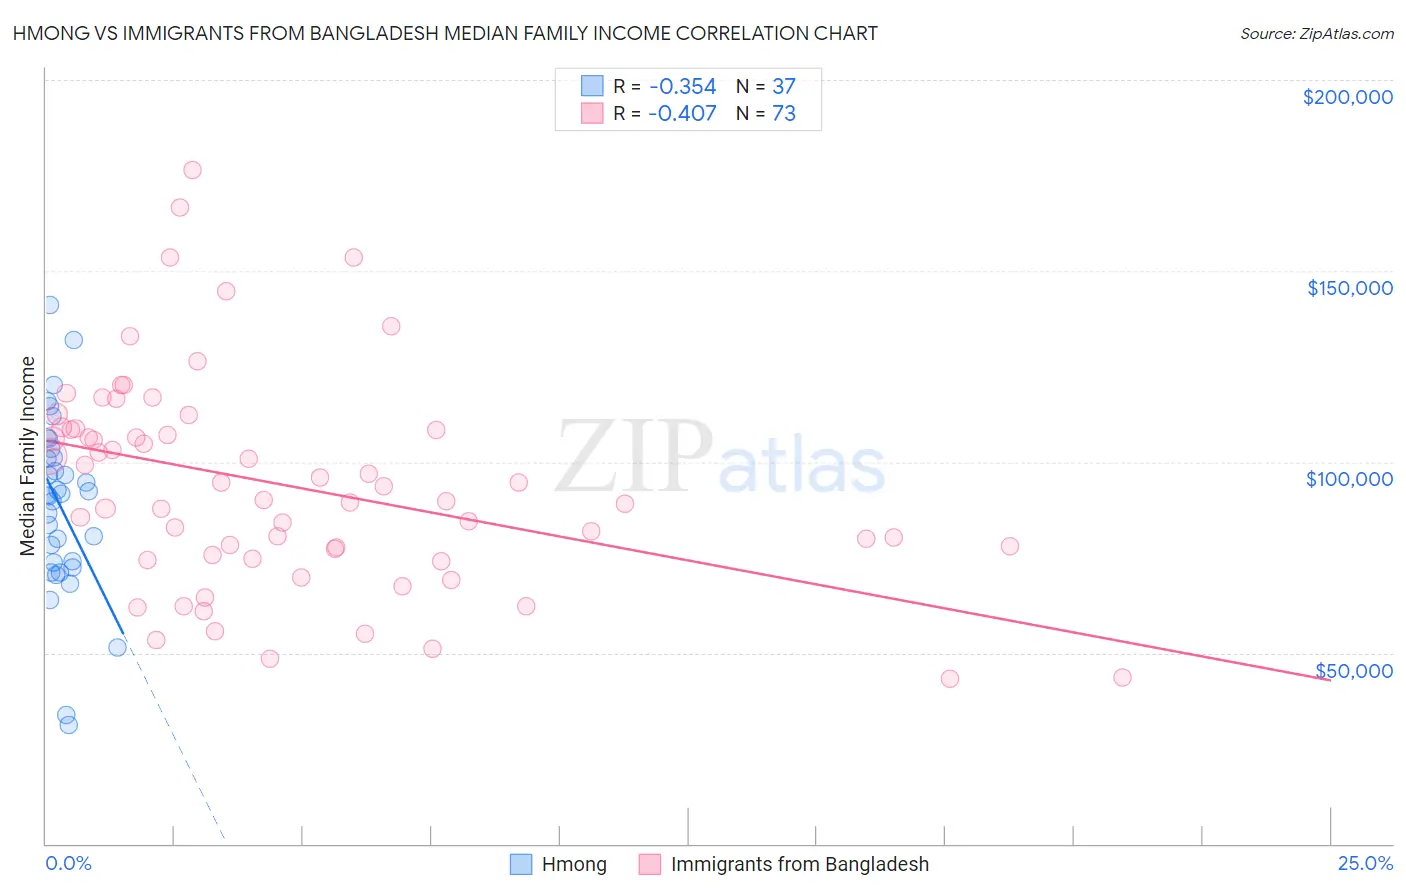
Hmong vs Immigrants from Bangladesh Median Family Income Correlation Chart
The statistical analysis conducted on geographies consisting of 24,655,529 people shows a mild negative correlation between the proportion of Hmong and median family income in the United States with a correlation coefficient (R) of -0.354 and weighted average of $91,296. Similarly, the statistical analysis conducted on geographies consisting of 203,503,484 people shows a moderate negative correlation between the proportion of Immigrants from Bangladesh and median family income in the United States with a correlation coefficient (R) of -0.407 and weighted average of $94,665, a difference of 3.7%.
Median Family Income Correlation Summary
| Measurement | Hmong | Immigrants from Bangladesh |
| Minimum | $31,056 | $43,315 |
| Maximum | $141,078 | $176,322 |
| Range | $110,022 | $133,007 |
| Mean | $88,552 | $93,798 |
| Median | $91,363 | $90,050 |
| Interquartile 25% (IQ1) | $73,027 | $75,060 |
| Interquartile 75% (IQ3) | $102,409 | $108,612 |
| Interquartile Range (IQR) | $29,382 | $33,553 |
| Standard Deviation (Sample) | $23,412 | $28,054 |
| Standard Deviation (Population) | $23,093 | $27,861 |
Similar Demographics by Median Family Income
Demographics Similar to Hmong by Median Family Income
In terms of median family income, the demographic groups most similar to Hmong are Senegalese ($91,475, a difference of 0.20%), Central American ($91,087, a difference of 0.23%), Immigrants from West Indies ($91,588, a difference of 0.32%), Mexican American Indian ($90,918, a difference of 0.42%), and Cree ($90,882, a difference of 0.46%).
| Demographics | Rating | Rank | Median Family Income |
| Osage | 0.4 /100 | #258 | Tragic $91,926 |
| Cape Verdeans | 0.4 /100 | #259 | Tragic $91,848 |
| Pennsylvania Germans | 0.4 /100 | #260 | Tragic $91,763 |
| Inupiat | 0.4 /100 | #261 | Tragic $91,730 |
| Liberians | 0.4 /100 | #262 | Tragic $91,722 |
| Immigrants | West Indies | 0.3 /100 | #263 | Tragic $91,588 |
| Senegalese | 0.3 /100 | #264 | Tragic $91,475 |
| Hmong | 0.3 /100 | #265 | Tragic $91,296 |
| Central Americans | 0.3 /100 | #266 | Tragic $91,087 |
| Mexican American Indians | 0.2 /100 | #267 | Tragic $90,918 |
| Cree | 0.2 /100 | #268 | Tragic $90,882 |
| Belizeans | 0.2 /100 | #269 | Tragic $90,880 |
| Jamaicans | 0.2 /100 | #270 | Tragic $90,581 |
| Iroquois | 0.2 /100 | #271 | Tragic $90,543 |
| Immigrants | Liberia | 0.2 /100 | #272 | Tragic $90,450 |
Demographics Similar to Immigrants from Bangladesh by Median Family Income
In terms of median family income, the demographic groups most similar to Immigrants from Bangladesh are Immigrants from Western Africa ($94,638, a difference of 0.030%), Immigrants from Burma/Myanmar ($94,472, a difference of 0.20%), Trinidadian and Tobagonian ($94,466, a difference of 0.21%), Immigrants from Venezuela ($94,904, a difference of 0.25%), and Alaskan Athabascan ($94,429, a difference of 0.25%).
| Demographics | Rating | Rank | Median Family Income |
| Immigrants | Panama | 2.7 /100 | #226 | Tragic $95,647 |
| Alaska Natives | 2.6 /100 | #227 | Tragic $95,573 |
| Immigrants | Azores | 2.4 /100 | #228 | Tragic $95,402 |
| Marshallese | 2.2 /100 | #229 | Tragic $95,293 |
| Malaysians | 2.2 /100 | #230 | Tragic $95,230 |
| Ecuadorians | 2.1 /100 | #231 | Tragic $95,114 |
| Immigrants | Venezuela | 1.9 /100 | #232 | Tragic $94,904 |
| Immigrants | Bangladesh | 1.6 /100 | #233 | Tragic $94,665 |
| Immigrants | Western Africa | 1.6 /100 | #234 | Tragic $94,638 |
| Immigrants | Burma/Myanmar | 1.5 /100 | #235 | Tragic $94,472 |
| Trinidadians and Tobagonians | 1.5 /100 | #236 | Tragic $94,466 |
| Alaskan Athabascans | 1.5 /100 | #237 | Tragic $94,429 |
| Nepalese | 1.3 /100 | #238 | Tragic $94,153 |
| Salvadorans | 1.2 /100 | #239 | Tragic $94,109 |
| Somalis | 1.2 /100 | #240 | Tragic $94,085 |