Hmong vs Immigrants from Liberia Householder Income Ages 25 - 44 years
COMPARE
Hmong
Immigrants from Liberia
Householder Income Ages 25 - 44 years
Householder Income Ages 25 - 44 years Comparison
Hmong
Immigrants from Liberia
$84,258
HOUSEHOLDER INCOME AGES 25 - 44 YEARS
0.3/ 100
METRIC RATING
267th/ 347
METRIC RANK
$80,863
HOUSEHOLDER INCOME AGES 25 - 44 YEARS
0.1/ 100
METRIC RATING
299th/ 347
METRIC RANK
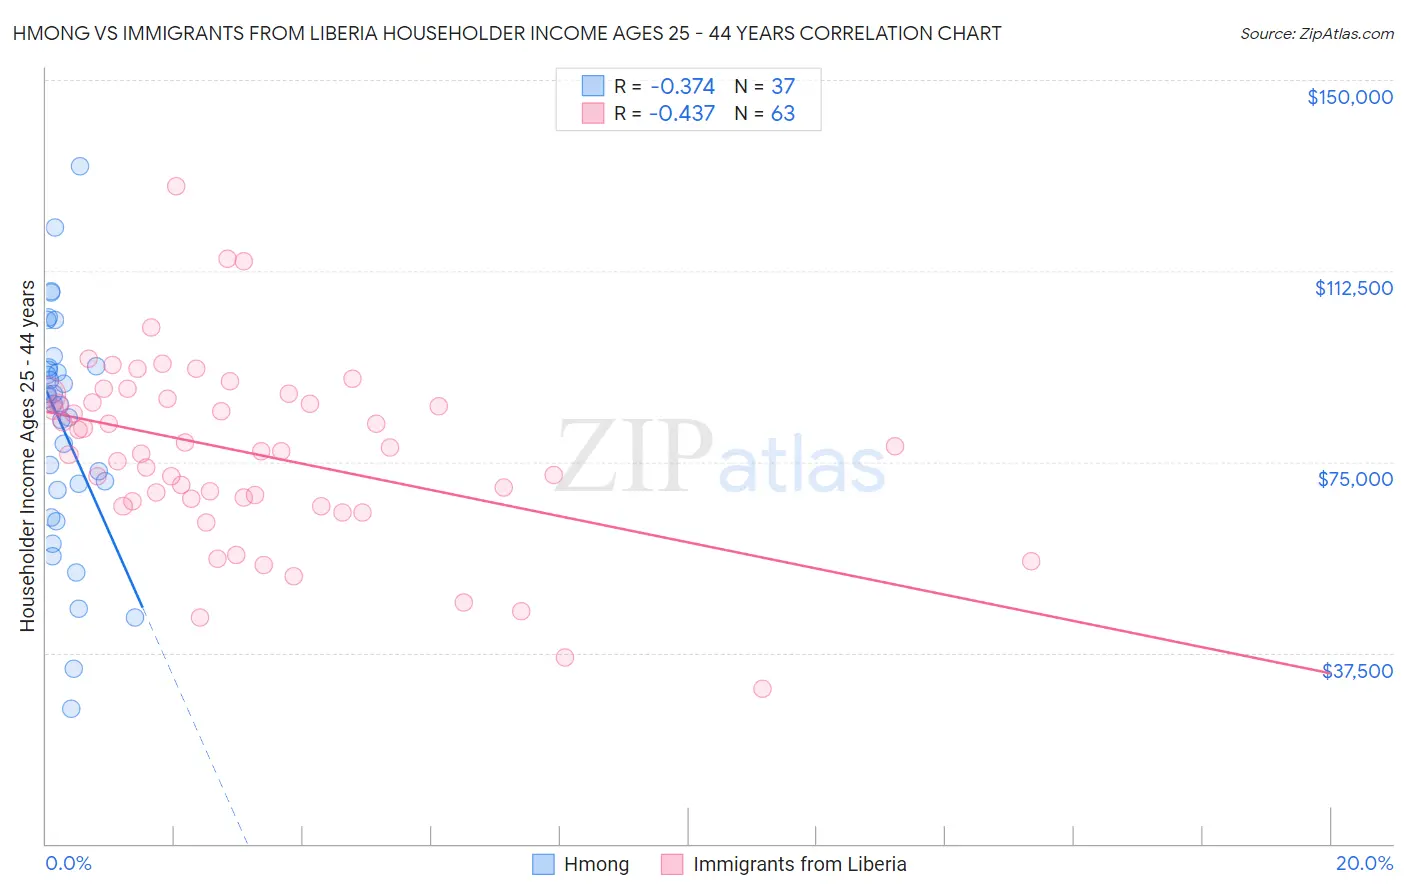
Hmong vs Immigrants from Liberia Householder Income Ages 25 - 44 years Correlation Chart
The statistical analysis conducted on geographies consisting of 24,651,789 people shows a mild negative correlation between the proportion of Hmong and household income with householder between the ages 25 and 44 in the United States with a correlation coefficient (R) of -0.374 and weighted average of $84,258. Similarly, the statistical analysis conducted on geographies consisting of 135,196,849 people shows a moderate negative correlation between the proportion of Immigrants from Liberia and household income with householder between the ages 25 and 44 in the United States with a correlation coefficient (R) of -0.437 and weighted average of $80,863, a difference of 4.2%.
Householder Income Ages 25 - 44 years Correlation Summary
| Measurement | Hmong | Immigrants from Liberia |
| Minimum | $26,488 | $30,517 |
| Maximum | $133,083 | $129,042 |
| Range | $106,595 | $98,525 |
| Mean | $81,379 | $76,665 |
| Median | $86,301 | $77,079 |
| Interquartile 25% (IQ1) | $66,711 | $67,377 |
| Interquartile 75% (IQ3) | $93,560 | $87,370 |
| Interquartile Range (IQR) | $26,850 | $19,994 |
| Standard Deviation (Sample) | $23,085 | $17,857 |
| Standard Deviation (Population) | $22,771 | $17,715 |
Similar Demographics by Householder Income Ages 25 - 44 years
Demographics Similar to Hmong by Householder Income Ages 25 - 44 years
In terms of householder income ages 25 - 44 years, the demographic groups most similar to Hmong are Subsaharan African ($84,235, a difference of 0.030%), Immigrants from Cabo Verde ($84,304, a difference of 0.050%), Sudanese ($84,401, a difference of 0.17%), Spanish American Indian ($84,085, a difference of 0.21%), and Osage ($84,461, a difference of 0.24%).
| Demographics | Rating | Rank | Householder Income Ages 25 - 44 years |
| Americans | 0.4 /100 | #260 | Tragic $84,791 |
| Inupiat | 0.4 /100 | #261 | Tragic $84,619 |
| Cree | 0.4 /100 | #262 | Tragic $84,574 |
| Belizeans | 0.4 /100 | #263 | Tragic $84,534 |
| Osage | 0.4 /100 | #264 | Tragic $84,461 |
| Sudanese | 0.4 /100 | #265 | Tragic $84,401 |
| Immigrants | Cabo Verde | 0.3 /100 | #266 | Tragic $84,304 |
| Hmong | 0.3 /100 | #267 | Tragic $84,258 |
| Sub-Saharan Africans | 0.3 /100 | #268 | Tragic $84,235 |
| Spanish American Indians | 0.3 /100 | #269 | Tragic $84,085 |
| Jamaicans | 0.3 /100 | #270 | Tragic $83,933 |
| Somalis | 0.2 /100 | #271 | Tragic $83,752 |
| Spanish Americans | 0.2 /100 | #272 | Tragic $83,722 |
| Iroquois | 0.2 /100 | #273 | Tragic $83,682 |
| Marshallese | 0.2 /100 | #274 | Tragic $83,575 |
Demographics Similar to Immigrants from Liberia by Householder Income Ages 25 - 44 years
In terms of householder income ages 25 - 44 years, the demographic groups most similar to Immigrants from Liberia are Cherokee ($80,843, a difference of 0.020%), Immigrants from Micronesia ($80,544, a difference of 0.40%), Hispanic or Latino ($80,515, a difference of 0.43%), Dominican ($81,229, a difference of 0.45%), and Mexican ($80,427, a difference of 0.54%).
| Demographics | Rating | Rank | Householder Income Ages 25 - 44 years |
| Yaqui | 0.1 /100 | #292 | Tragic $81,656 |
| Blackfeet | 0.1 /100 | #293 | Tragic $81,531 |
| Cubans | 0.1 /100 | #294 | Tragic $81,483 |
| Bangladeshis | 0.1 /100 | #295 | Tragic $81,363 |
| Immigrants | Dominica | 0.1 /100 | #296 | Tragic $81,351 |
| Immigrants | Guatemala | 0.1 /100 | #297 | Tragic $81,341 |
| Dominicans | 0.1 /100 | #298 | Tragic $81,229 |
| Immigrants | Liberia | 0.1 /100 | #299 | Tragic $80,863 |
| Cherokee | 0.0 /100 | #300 | Tragic $80,843 |
| Immigrants | Micronesia | 0.0 /100 | #301 | Tragic $80,544 |
| Hispanics or Latinos | 0.0 /100 | #302 | Tragic $80,515 |
| Mexicans | 0.0 /100 | #303 | Tragic $80,427 |
| Immigrants | Caribbean | 0.0 /100 | #304 | Tragic $80,326 |
| Immigrants | Dominican Republic | 0.0 /100 | #305 | Tragic $80,319 |
| Apache | 0.0 /100 | #306 | Tragic $80,260 |