Hispanic or Latino vs Cape Verdean Householder Income Ages 45 - 64 years
COMPARE
Hispanic or Latino
Cape Verdean
Householder Income Ages 45 - 64 years
Householder Income Ages 45 - 64 years Comparison
Hispanics or Latinos
Cape Verdeans
$86,006
HOUSEHOLDER INCOME AGES 45 - 64 YEARS
0.1/ 100
METRIC RATING
291st/ 347
METRIC RANK
$87,580
HOUSEHOLDER INCOME AGES 45 - 64 YEARS
0.2/ 100
METRIC RATING
272nd/ 347
METRIC RANK
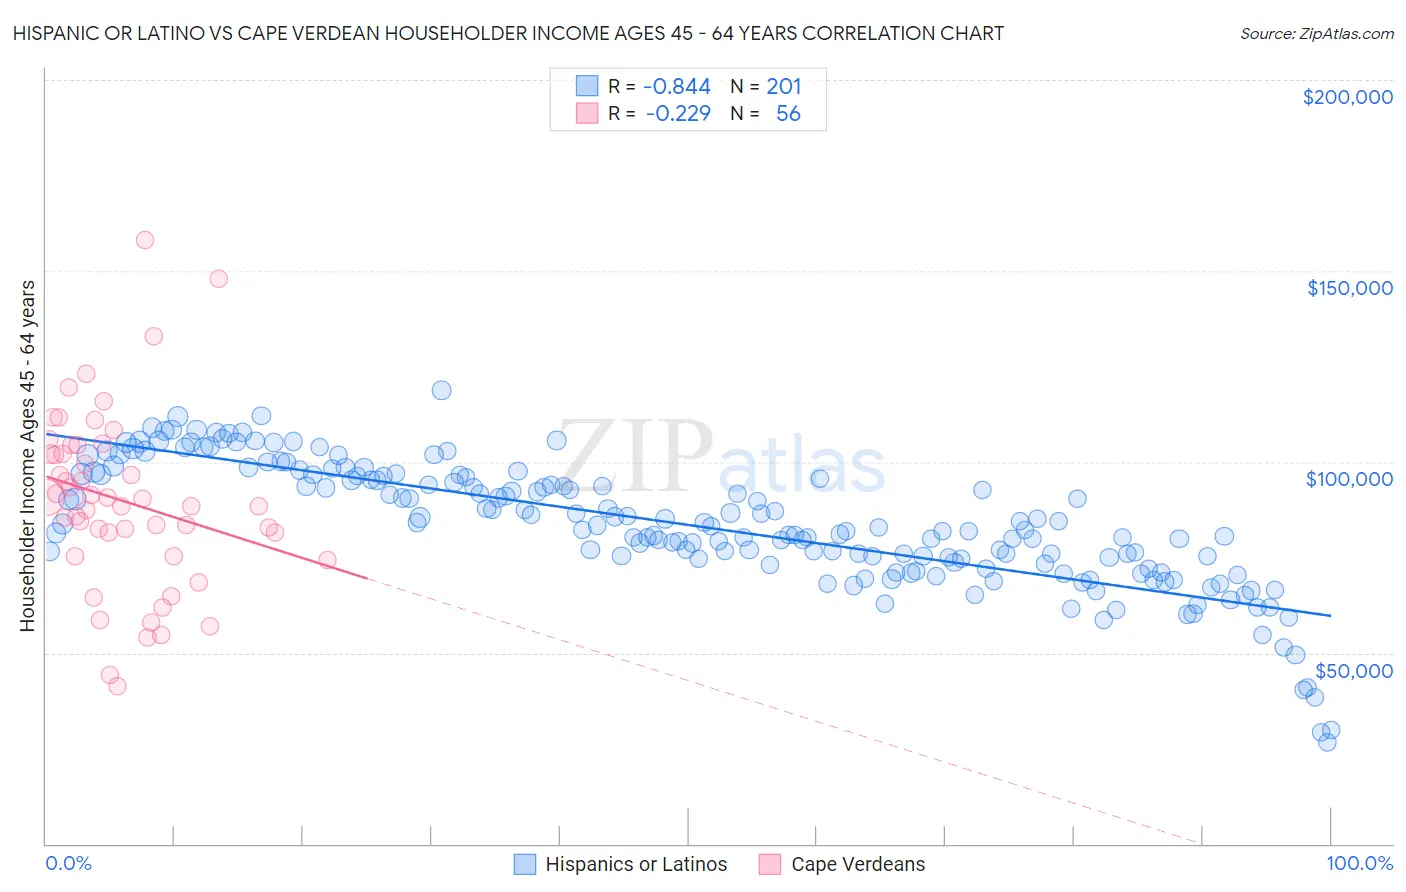
Hispanic or Latino vs Cape Verdean Householder Income Ages 45 - 64 years Correlation Chart
The statistical analysis conducted on geographies consisting of 574,103,825 people shows a very strong negative correlation between the proportion of Hispanics or Latinos and household income with householder between the ages 45 and 64 in the United States with a correlation coefficient (R) of -0.844 and weighted average of $86,006. Similarly, the statistical analysis conducted on geographies consisting of 107,500,216 people shows a weak negative correlation between the proportion of Cape Verdeans and household income with householder between the ages 45 and 64 in the United States with a correlation coefficient (R) of -0.229 and weighted average of $87,580, a difference of 1.8%.
Householder Income Ages 45 - 64 years Correlation Summary
| Measurement | Hispanic or Latino | Cape Verdean |
| Minimum | $26,626 | $41,310 |
| Maximum | $118,670 | $158,026 |
| Range | $92,045 | $116,716 |
| Mean | $83,367 | $89,896 |
| Median | $82,863 | $89,458 |
| Interquartile 25% (IQ1) | $74,106 | $78,368 |
| Interquartile 75% (IQ3) | $96,088 | $103,256 |
| Interquartile Range (IQR) | $21,982 | $24,888 |
| Standard Deviation (Sample) | $16,403 | $23,178 |
| Standard Deviation (Population) | $16,362 | $22,970 |
Demographics Similar to Hispanics or Latinos and Cape Verdeans by Householder Income Ages 45 - 64 years
In terms of householder income ages 45 - 64 years, the demographic groups most similar to Hispanics or Latinos are Cherokee ($86,125, a difference of 0.14%), Cuban ($86,301, a difference of 0.34%), Immigrants from St. Vincent and the Grenadines ($86,394, a difference of 0.45%), Bangladeshi ($86,402, a difference of 0.46%), and Immigrants from Guatemala ($86,573, a difference of 0.66%). Similarly, the demographic groups most similar to Cape Verdeans are Spanish American Indian ($87,561, a difference of 0.020%), Guatemalan ($87,705, a difference of 0.14%), Iroquois ($87,255, a difference of 0.37%), Immigrants from Belize ($87,229, a difference of 0.40%), and Immigrants from Latin America ($87,219, a difference of 0.41%).
| Demographics | Rating | Rank | Householder Income Ages 45 - 64 years |
| Guatemalans | 0.2 /100 | #271 | Tragic $87,705 |
| Cape Verdeans | 0.2 /100 | #272 | Tragic $87,580 |
| Spanish American Indians | 0.2 /100 | #273 | Tragic $87,561 |
| Iroquois | 0.1 /100 | #274 | Tragic $87,255 |
| Immigrants | Belize | 0.1 /100 | #275 | Tragic $87,229 |
| Immigrants | Latin America | 0.1 /100 | #276 | Tragic $87,219 |
| Cree | 0.1 /100 | #277 | Tragic $87,185 |
| Immigrants | Jamaica | 0.1 /100 | #278 | Tragic $87,035 |
| Yakama | 0.1 /100 | #279 | Tragic $86,992 |
| Immigrants | Somalia | 0.1 /100 | #280 | Tragic $86,987 |
| Yaqui | 0.1 /100 | #281 | Tragic $86,914 |
| Senegalese | 0.1 /100 | #282 | Tragic $86,897 |
| Mexicans | 0.1 /100 | #283 | Tragic $86,816 |
| Central American Indians | 0.1 /100 | #284 | Tragic $86,764 |
| Blackfeet | 0.1 /100 | #285 | Tragic $86,595 |
| Immigrants | Guatemala | 0.1 /100 | #286 | Tragic $86,573 |
| Bangladeshis | 0.1 /100 | #287 | Tragic $86,402 |
| Immigrants | St. Vincent and the Grenadines | 0.1 /100 | #288 | Tragic $86,394 |
| Cubans | 0.1 /100 | #289 | Tragic $86,301 |
| Cherokee | 0.1 /100 | #290 | Tragic $86,125 |
| Hispanics or Latinos | 0.1 /100 | #291 | Tragic $86,006 |