Hispanic or Latino vs Immigrants from Cameroon Householder Income Ages 45 - 64 years
COMPARE
Hispanic or Latino
Immigrants from Cameroon
Householder Income Ages 45 - 64 years
Householder Income Ages 45 - 64 years Comparison
Hispanics or Latinos
Immigrants from Cameroon
$86,006
HOUSEHOLDER INCOME AGES 45 - 64 YEARS
0.1/ 100
METRIC RATING
291st/ 347
METRIC RANK
$100,084
HOUSEHOLDER INCOME AGES 45 - 64 YEARS
47.0/ 100
METRIC RATING
178th/ 347
METRIC RANK
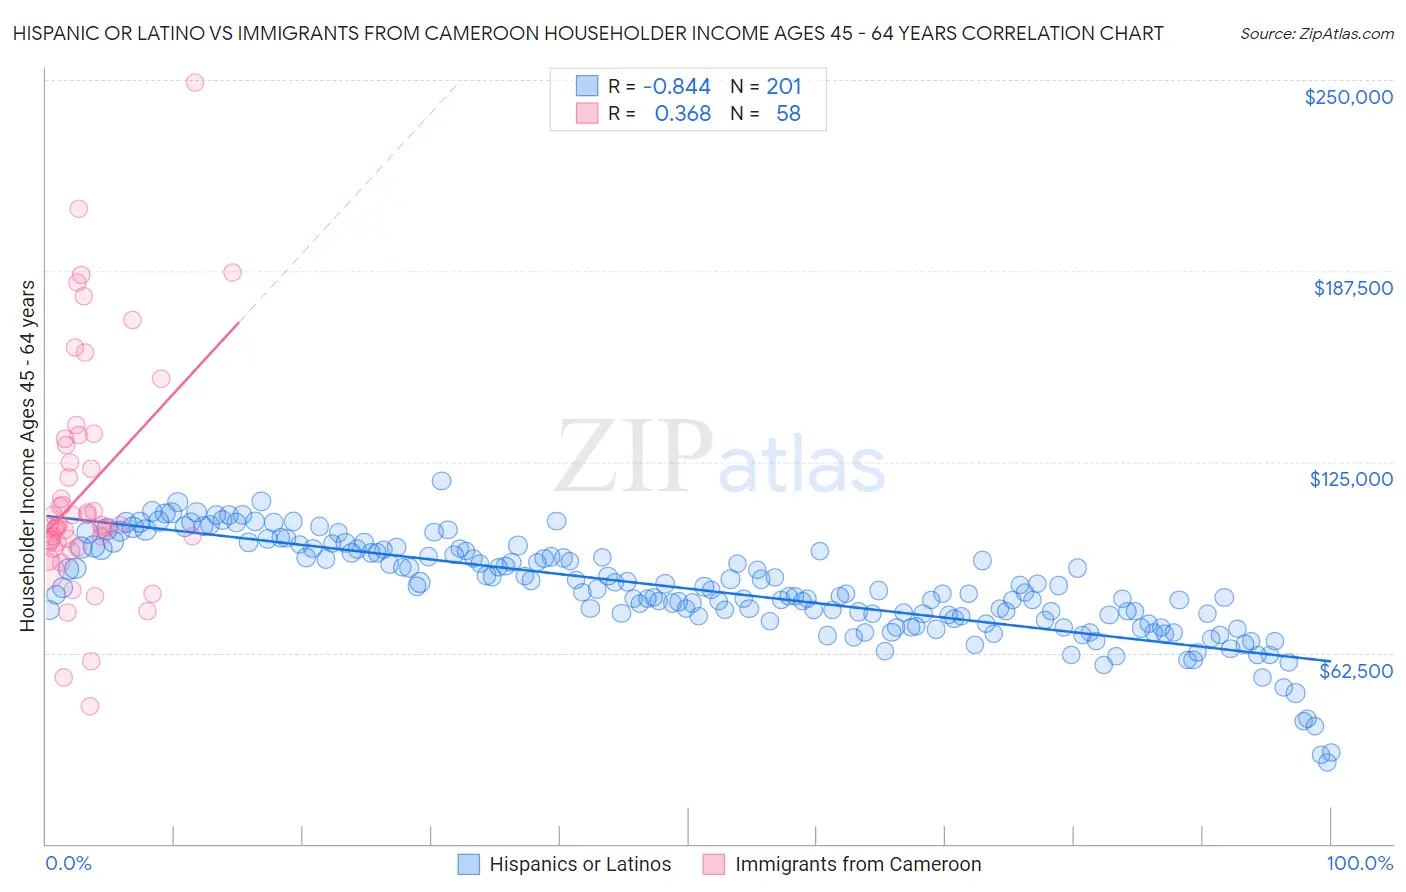
Hispanic or Latino vs Immigrants from Cameroon Householder Income Ages 45 - 64 years Correlation Chart
The statistical analysis conducted on geographies consisting of 574,103,825 people shows a very strong negative correlation between the proportion of Hispanics or Latinos and household income with householder between the ages 45 and 64 in the United States with a correlation coefficient (R) of -0.844 and weighted average of $86,006. Similarly, the statistical analysis conducted on geographies consisting of 130,699,508 people shows a mild positive correlation between the proportion of Immigrants from Cameroon and household income with householder between the ages 45 and 64 in the United States with a correlation coefficient (R) of 0.368 and weighted average of $100,084, a difference of 16.4%.
Householder Income Ages 45 - 64 years Correlation Summary
| Measurement | Hispanic or Latino | Immigrants from Cameroon |
| Minimum | $26,626 | $45,128 |
| Maximum | $118,670 | $249,250 |
| Range | $92,045 | $204,122 |
| Mean | $83,367 | $115,608 |
| Median | $82,863 | $104,009 |
| Interquartile 25% (IQ1) | $74,106 | $98,639 |
| Interquartile 75% (IQ3) | $96,088 | $130,520 |
| Interquartile Range (IQR) | $21,982 | $31,881 |
| Standard Deviation (Sample) | $16,403 | $37,628 |
| Standard Deviation (Population) | $16,362 | $37,302 |
Similar Demographics by Householder Income Ages 45 - 64 years
Demographics Similar to Hispanics or Latinos by Householder Income Ages 45 - 64 years
In terms of householder income ages 45 - 64 years, the demographic groups most similar to Hispanics or Latinos are Immigrants from Central America ($85,965, a difference of 0.050%), Cherokee ($86,125, a difference of 0.14%), Comanche ($85,787, a difference of 0.25%), Cuban ($86,301, a difference of 0.34%), and Immigrants from St. Vincent and the Grenadines ($86,394, a difference of 0.45%).
| Demographics | Rating | Rank | Householder Income Ages 45 - 64 years |
| Central American Indians | 0.1 /100 | #284 | Tragic $86,764 |
| Blackfeet | 0.1 /100 | #285 | Tragic $86,595 |
| Immigrants | Guatemala | 0.1 /100 | #286 | Tragic $86,573 |
| Bangladeshis | 0.1 /100 | #287 | Tragic $86,402 |
| Immigrants | St. Vincent and the Grenadines | 0.1 /100 | #288 | Tragic $86,394 |
| Cubans | 0.1 /100 | #289 | Tragic $86,301 |
| Cherokee | 0.1 /100 | #290 | Tragic $86,125 |
| Hispanics or Latinos | 0.1 /100 | #291 | Tragic $86,006 |
| Immigrants | Central America | 0.1 /100 | #292 | Tragic $85,965 |
| Comanche | 0.1 /100 | #293 | Tragic $85,787 |
| British West Indians | 0.1 /100 | #294 | Tragic $85,571 |
| Immigrants | Grenada | 0.1 /100 | #295 | Tragic $85,552 |
| Immigrants | Zaire | 0.1 /100 | #296 | Tragic $85,207 |
| Fijians | 0.1 /100 | #297 | Tragic $85,187 |
| Africans | 0.0 /100 | #298 | Tragic $84,925 |
Demographics Similar to Immigrants from Cameroon by Householder Income Ages 45 - 64 years
In terms of householder income ages 45 - 64 years, the demographic groups most similar to Immigrants from Cameroon are Belgian ($100,060, a difference of 0.020%), Aleut ($100,052, a difference of 0.030%), Moroccan ($100,138, a difference of 0.050%), Immigrants from Costa Rica ($100,141, a difference of 0.060%), and German ($100,224, a difference of 0.14%).
| Demographics | Rating | Rank | Householder Income Ages 45 - 64 years |
| South Americans | 56.4 /100 | #171 | Average $100,837 |
| Immigrants | Uzbekistan | 52.5 /100 | #172 | Average $100,523 |
| Alsatians | 51.4 /100 | #173 | Average $100,435 |
| Welsh | 50.0 /100 | #174 | Average $100,322 |
| Germans | 48.8 /100 | #175 | Average $100,224 |
| Immigrants | Costa Rica | 47.7 /100 | #176 | Average $100,141 |
| Moroccans | 47.7 /100 | #177 | Average $100,138 |
| Immigrants | Cameroon | 47.0 /100 | #178 | Average $100,084 |
| Belgians | 46.7 /100 | #179 | Average $100,060 |
| Aleuts | 46.6 /100 | #180 | Average $100,052 |
| Immigrants | Immigrants | 45.3 /100 | #181 | Average $99,943 |
| Finns | 44.8 /100 | #182 | Average $99,904 |
| Spaniards | 44.6 /100 | #183 | Average $99,889 |
| French | 43.8 /100 | #184 | Average $99,824 |
| Colombians | 43.2 /100 | #185 | Average $99,772 |