Hispanic or Latino vs Immigrants from South Africa Child Poverty Among Girls Under 16
COMPARE
Hispanic or Latino
Immigrants from South Africa
Child Poverty Among Girls Under 16
Child Poverty Among Girls Under 16 Comparison
Hispanics or Latinos
Immigrants from South Africa
21.0%
CHILD POVERTY AMONG GIRLS UNDER 16
0.0/ 100
METRIC RATING
299th/ 347
METRIC RANK
15.0%
CHILD POVERTY AMONG GIRLS UNDER 16
95.6/ 100
METRIC RATING
101st/ 347
METRIC RANK
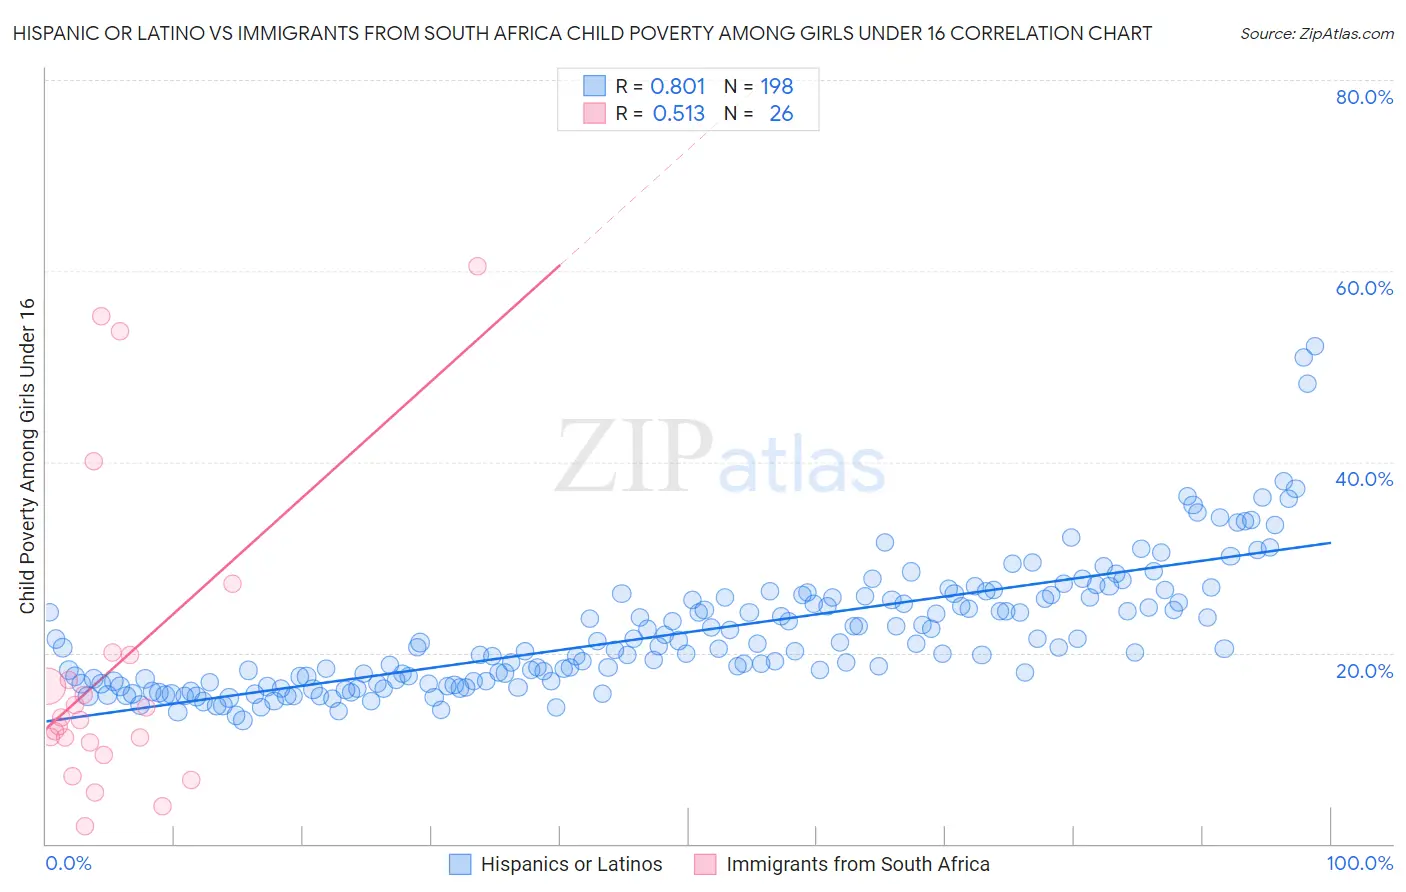
Hispanic or Latino vs Immigrants from South Africa Child Poverty Among Girls Under 16 Correlation Chart
The statistical analysis conducted on geographies consisting of 552,365,780 people shows a very strong positive correlation between the proportion of Hispanics or Latinos and poverty level among girls under the age of 16 in the United States with a correlation coefficient (R) of 0.801 and weighted average of 21.0%. Similarly, the statistical analysis conducted on geographies consisting of 230,120,116 people shows a substantial positive correlation between the proportion of Immigrants from South Africa and poverty level among girls under the age of 16 in the United States with a correlation coefficient (R) of 0.513 and weighted average of 15.0%, a difference of 39.6%.
Child Poverty Among Girls Under 16 Correlation Summary
| Measurement | Hispanic or Latino | Immigrants from South Africa |
| Minimum | 12.9% | 1.8% |
| Maximum | 52.1% | 60.5% |
| Range | 39.2% | 58.6% |
| Mean | 22.1% | 18.6% |
| Median | 20.5% | 13.1% |
| Interquartile 25% (IQ1) | 16.9% | 10.6% |
| Interquartile 75% (IQ3) | 25.7% | 19.8% |
| Interquartile Range (IQR) | 8.8% | 9.2% |
| Standard Deviation (Sample) | 6.7% | 15.9% |
| Standard Deviation (Population) | 6.7% | 15.6% |
Similar Demographics by Child Poverty Among Girls Under 16
Demographics Similar to Hispanics or Latinos by Child Poverty Among Girls Under 16
In terms of child poverty among girls under 16, the demographic groups most similar to Hispanics or Latinos are Somali (21.0%, a difference of 0.31%), Mexican (20.9%, a difference of 0.40%), Inupiat (20.8%, a difference of 0.93%), Choctaw (21.1%, a difference of 0.93%), and Immigrants from West Indies (20.7%, a difference of 1.0%).
| Demographics | Rating | Rank | Child Poverty Among Girls Under 16 |
| Immigrants | Latin America | 0.0 /100 | #292 | Tragic 20.6% |
| Immigrants | Grenada | 0.0 /100 | #293 | Tragic 20.7% |
| Immigrants | Senegal | 0.0 /100 | #294 | Tragic 20.7% |
| Immigrants | Caribbean | 0.0 /100 | #295 | Tragic 20.7% |
| Immigrants | West Indies | 0.0 /100 | #296 | Tragic 20.7% |
| Inupiat | 0.0 /100 | #297 | Tragic 20.8% |
| Mexicans | 0.0 /100 | #298 | Tragic 20.9% |
| Hispanics or Latinos | 0.0 /100 | #299 | Tragic 21.0% |
| Somalis | 0.0 /100 | #300 | Tragic 21.0% |
| Choctaw | 0.0 /100 | #301 | Tragic 21.1% |
| Seminole | 0.0 /100 | #302 | Tragic 21.2% |
| British West Indians | 0.0 /100 | #303 | Tragic 21.3% |
| Indonesians | 0.0 /100 | #304 | Tragic 21.3% |
| Guatemalans | 0.0 /100 | #305 | Tragic 21.4% |
| Immigrants | Central America | 0.0 /100 | #306 | Tragic 21.4% |
Demographics Similar to Immigrants from South Africa by Child Poverty Among Girls Under 16
In terms of child poverty among girls under 16, the demographic groups most similar to Immigrants from South Africa are Immigrants from Malaysia (15.0%, a difference of 0.010%), Paraguayan (15.0%, a difference of 0.030%), British (15.0%, a difference of 0.030%), Immigrants from Egypt (15.0%, a difference of 0.070%), and Romanian (15.0%, a difference of 0.19%).
| Demographics | Rating | Rank | Child Poverty Among Girls Under 16 |
| Immigrants | Switzerland | 96.3 /100 | #94 | Exceptional 14.9% |
| Germans | 96.3 /100 | #95 | Exceptional 14.9% |
| Immigrants | France | 96.2 /100 | #96 | Exceptional 14.9% |
| Immigrants | Latvia | 96.1 /100 | #97 | Exceptional 14.9% |
| Basques | 95.9 /100 | #98 | Exceptional 15.0% |
| Immigrants | Egypt | 95.7 /100 | #99 | Exceptional 15.0% |
| Paraguayans | 95.7 /100 | #100 | Exceptional 15.0% |
| Immigrants | South Africa | 95.6 /100 | #101 | Exceptional 15.0% |
| Immigrants | Malaysia | 95.6 /100 | #102 | Exceptional 15.0% |
| British | 95.6 /100 | #103 | Exceptional 15.0% |
| Romanians | 95.3 /100 | #104 | Exceptional 15.0% |
| Immigrants | England | 95.1 /100 | #105 | Exceptional 15.1% |
| Chileans | 95.1 /100 | #106 | Exceptional 15.1% |
| Immigrants | Ukraine | 95.0 /100 | #107 | Exceptional 15.1% |
| Immigrants | Brazil | 94.9 /100 | #108 | Exceptional 15.1% |