Hispanic or Latino vs Immigrants from El Salvador Householder Income Over 65 years
COMPARE
Hispanic or Latino
Immigrants from El Salvador
Householder Income Over 65 years
Householder Income Over 65 years Comparison
Hispanics or Latinos
Immigrants from El Salvador
$52,832
HOUSEHOLDER INCOME OVER 65 YEARS
0.0/ 100
METRIC RATING
307th/ 347
METRIC RANK
$58,226
HOUSEHOLDER INCOME OVER 65 YEARS
5.4/ 100
METRIC RATING
221st/ 347
METRIC RANK
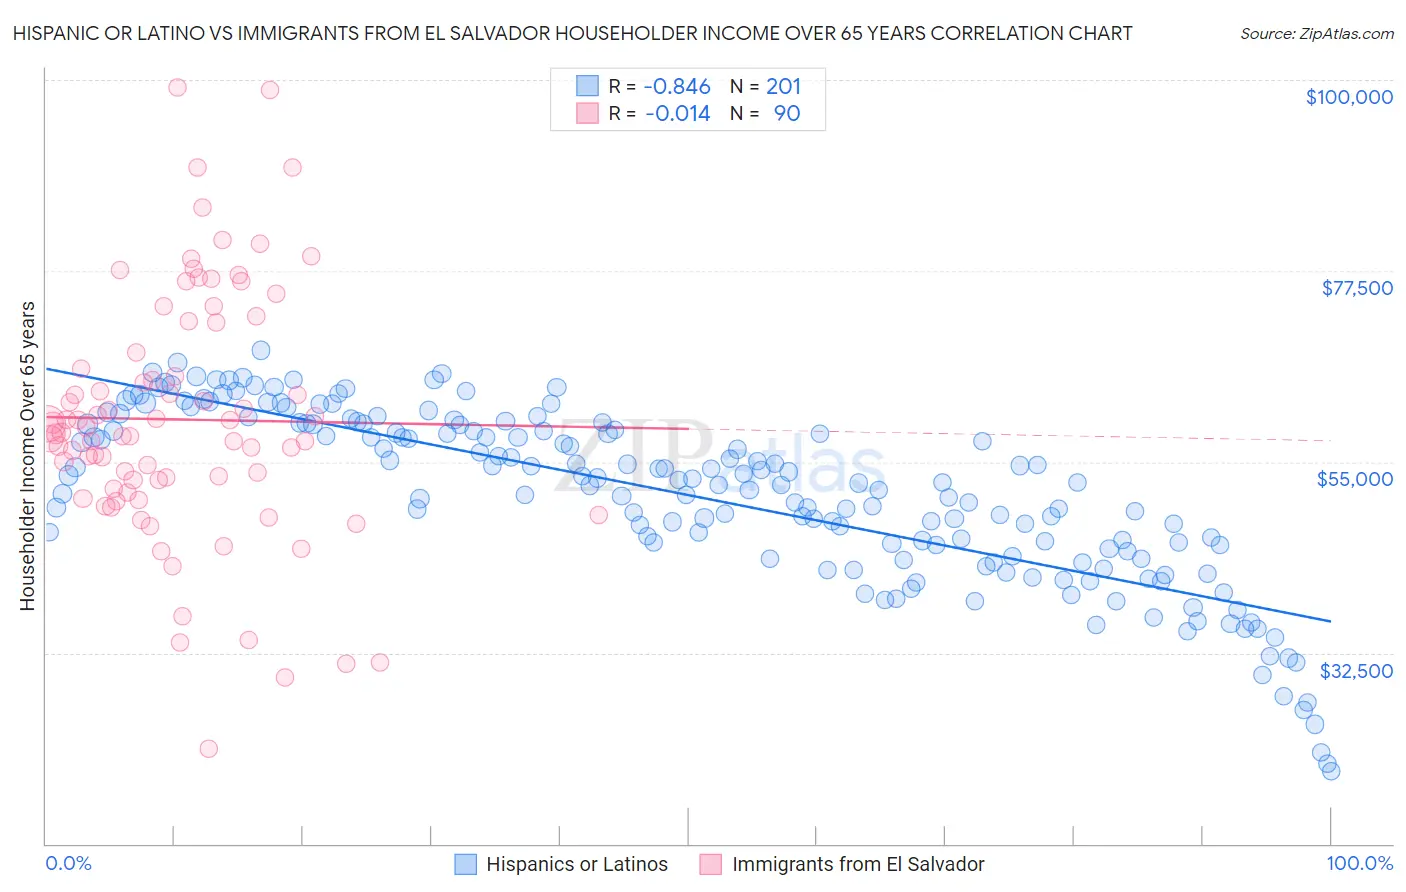
Hispanic or Latino vs Immigrants from El Salvador Householder Income Over 65 years Correlation Chart
The statistical analysis conducted on geographies consisting of 572,369,313 people shows a very strong negative correlation between the proportion of Hispanics or Latinos and household income with householder over the age of 65 in the United States with a correlation coefficient (R) of -0.846 and weighted average of $52,832. Similarly, the statistical analysis conducted on geographies consisting of 356,778,266 people shows no correlation between the proportion of Immigrants from El Salvador and household income with householder over the age of 65 in the United States with a correlation coefficient (R) of -0.014 and weighted average of $58,226, a difference of 10.2%.
Householder Income Over 65 years Correlation Summary
| Measurement | Hispanic or Latino | Immigrants from El Salvador |
| Minimum | $18,538 | $21,250 |
| Maximum | $68,171 | $99,153 |
| Range | $49,633 | $77,903 |
| Mean | $51,010 | $59,987 |
| Median | $52,570 | $58,385 |
| Interquartile 25% (IQ1) | $44,659 | $51,905 |
| Interquartile 75% (IQ3) | $59,438 | $67,842 |
| Interquartile Range (IQR) | $14,779 | $15,937 |
| Standard Deviation (Sample) | $10,248 | $14,614 |
| Standard Deviation (Population) | $10,222 | $14,532 |
Similar Demographics by Householder Income Over 65 years
Demographics Similar to Hispanics or Latinos by Householder Income Over 65 years
In terms of householder income over 65 years, the demographic groups most similar to Hispanics or Latinos are Immigrants from Mexico ($52,801, a difference of 0.060%), Pennsylvania German ($52,888, a difference of 0.11%), Pueblo ($52,930, a difference of 0.19%), Ute ($52,949, a difference of 0.22%), and Honduran ($52,634, a difference of 0.38%).
| Demographics | Rating | Rank | Householder Income Over 65 years |
| Immigrants | Bahamas | 0.0 /100 | #300 | Tragic $53,174 |
| Yuman | 0.0 /100 | #301 | Tragic $53,110 |
| Spanish American Indians | 0.0 /100 | #302 | Tragic $53,077 |
| Choctaw | 0.0 /100 | #303 | Tragic $53,060 |
| Ute | 0.0 /100 | #304 | Tragic $52,949 |
| Pueblo | 0.0 /100 | #305 | Tragic $52,930 |
| Pennsylvania Germans | 0.0 /100 | #306 | Tragic $52,888 |
| Hispanics or Latinos | 0.0 /100 | #307 | Tragic $52,832 |
| Immigrants | Mexico | 0.0 /100 | #308 | Tragic $52,801 |
| Hondurans | 0.0 /100 | #309 | Tragic $52,634 |
| Sioux | 0.0 /100 | #310 | Tragic $52,509 |
| Seminole | 0.0 /100 | #311 | Tragic $52,373 |
| Immigrants | Azores | 0.0 /100 | #312 | Tragic $52,121 |
| Immigrants | Nicaragua | 0.0 /100 | #313 | Tragic $52,085 |
| Natives/Alaskans | 0.0 /100 | #314 | Tragic $52,081 |
Demographics Similar to Immigrants from El Salvador by Householder Income Over 65 years
In terms of householder income over 65 years, the demographic groups most similar to Immigrants from El Salvador are Delaware ($58,214, a difference of 0.020%), Malaysian ($58,244, a difference of 0.030%), Yugoslavian ($58,243, a difference of 0.030%), Tsimshian ($58,202, a difference of 0.040%), and Panamanian ($58,266, a difference of 0.070%).
| Demographics | Rating | Rank | Householder Income Over 65 years |
| Nepalese | 9.0 /100 | #214 | Tragic $58,761 |
| Immigrants | Ghana | 7.9 /100 | #215 | Tragic $58,624 |
| Immigrants | Middle Africa | 6.2 /100 | #216 | Tragic $58,375 |
| Sudanese | 5.7 /100 | #217 | Tragic $58,281 |
| Panamanians | 5.6 /100 | #218 | Tragic $58,266 |
| Malaysians | 5.5 /100 | #219 | Tragic $58,244 |
| Yugoslavians | 5.5 /100 | #220 | Tragic $58,243 |
| Immigrants | El Salvador | 5.4 /100 | #221 | Tragic $58,226 |
| Delaware | 5.3 /100 | #222 | Tragic $58,214 |
| Tsimshian | 5.2 /100 | #223 | Tragic $58,202 |
| Bermudans | 5.1 /100 | #224 | Tragic $58,171 |
| Venezuelans | 4.4 /100 | #225 | Tragic $58,026 |
| French Canadians | 4.2 /100 | #226 | Tragic $57,975 |
| Japanese | 3.9 /100 | #227 | Tragic $57,919 |
| Immigrants | Albania | 3.6 /100 | #228 | Tragic $57,828 |