Hawaiian vs English Per Capita Income
COMPARE
Hawaiian
English
Per Capita Income
Per Capita Income Comparison
Hawaiians
English
$39,403
PER CAPITA INCOME
0.8/ 100
METRIC RATING
256th/ 347
METRIC RANK
$43,982
PER CAPITA INCOME
58.9/ 100
METRIC RATING
167th/ 347
METRIC RANK
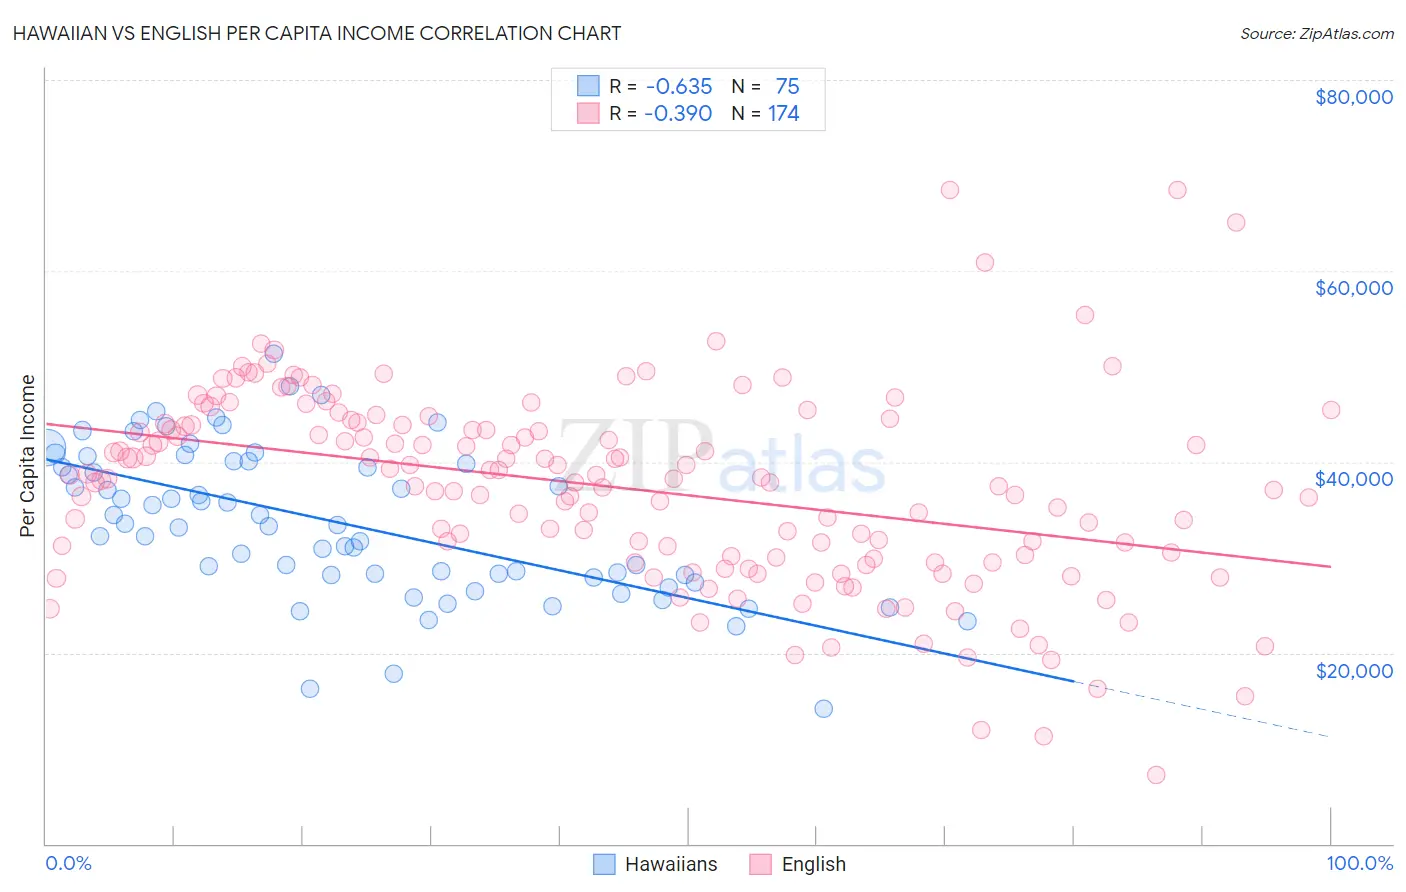
Hawaiian vs English Per Capita Income Correlation Chart
The statistical analysis conducted on geographies consisting of 327,629,067 people shows a significant negative correlation between the proportion of Hawaiians and per capita income in the United States with a correlation coefficient (R) of -0.635 and weighted average of $39,403. Similarly, the statistical analysis conducted on geographies consisting of 580,041,700 people shows a mild negative correlation between the proportion of English and per capita income in the United States with a correlation coefficient (R) of -0.390 and weighted average of $43,982, a difference of 11.6%.
Per Capita Income Correlation Summary
| Measurement | Hawaiian | English |
| Minimum | $14,082 | $7,241 |
| Maximum | $51,335 | $68,486 |
| Range | $37,253 | $61,245 |
| Mean | $33,620 | $37,333 |
| Median | $33,340 | $38,254 |
| Interquartile 25% (IQ1) | $28,161 | $30,036 |
| Interquartile 75% (IQ3) | $40,110 | $44,055 |
| Interquartile Range (IQR) | $11,949 | $14,019 |
| Standard Deviation (Sample) | $7,838 | $10,214 |
| Standard Deviation (Population) | $7,785 | $10,184 |
Similar Demographics by Per Capita Income
Demographics Similar to Hawaiians by Per Capita Income
In terms of per capita income, the demographic groups most similar to Hawaiians are Nicaraguan ($39,372, a difference of 0.080%), Immigrants from Middle Africa ($39,529, a difference of 0.32%), Alaska Native ($39,558, a difference of 0.39%), Osage ($39,568, a difference of 0.42%), and Jamaican ($39,231, a difference of 0.44%).
| Demographics | Rating | Rank | Per Capita Income |
| Japanese | 1.4 /100 | #249 | Tragic $39,870 |
| Immigrants | Burma/Myanmar | 1.3 /100 | #250 | Tragic $39,827 |
| Samoans | 1.3 /100 | #251 | Tragic $39,826 |
| Immigrants | Azores | 1.0 /100 | #252 | Tragic $39,608 |
| Osage | 1.0 /100 | #253 | Tragic $39,568 |
| Alaska Natives | 1.0 /100 | #254 | Tragic $39,558 |
| Immigrants | Middle Africa | 1.0 /100 | #255 | Tragic $39,529 |
| Hawaiians | 0.8 /100 | #256 | Tragic $39,403 |
| Nicaraguans | 0.8 /100 | #257 | Tragic $39,372 |
| Jamaicans | 0.7 /100 | #258 | Tragic $39,231 |
| Malaysians | 0.7 /100 | #259 | Tragic $39,194 |
| Alaskan Athabascans | 0.6 /100 | #260 | Tragic $39,163 |
| Marshallese | 0.6 /100 | #261 | Tragic $39,108 |
| Iroquois | 0.6 /100 | #262 | Tragic $39,104 |
| Belizeans | 0.6 /100 | #263 | Tragic $39,097 |
Demographics Similar to English by Per Capita Income
In terms of per capita income, the demographic groups most similar to English are Immigrants from Uruguay ($43,997, a difference of 0.030%), Immigrants from Philippines ($44,000, a difference of 0.040%), Sri Lankan ($44,014, a difference of 0.070%), Belgian ($43,951, a difference of 0.070%), and Immigrants from South America ($44,068, a difference of 0.19%).
| Demographics | Rating | Rank | Per Capita Income |
| Danes | 61.9 /100 | #160 | Good $44,095 |
| Costa Ricans | 61.8 /100 | #161 | Good $44,090 |
| Swiss | 61.4 /100 | #162 | Good $44,076 |
| Immigrants | South America | 61.2 /100 | #163 | Good $44,068 |
| Sri Lankans | 59.8 /100 | #164 | Average $44,014 |
| Immigrants | Philippines | 59.4 /100 | #165 | Average $44,000 |
| Immigrants | Uruguay | 59.3 /100 | #166 | Average $43,997 |
| English | 58.9 /100 | #167 | Average $43,982 |
| Belgians | 58.1 /100 | #168 | Average $43,951 |
| Immigrants | Peru | 55.3 /100 | #169 | Average $43,852 |
| Scandinavians | 55.2 /100 | #170 | Average $43,848 |
| Immigrants | Eastern Africa | 54.9 /100 | #171 | Average $43,838 |
| Czechoslovakians | 54.1 /100 | #172 | Average $43,806 |
| French | 50.7 /100 | #173 | Average $43,685 |
| Colombians | 50.0 /100 | #174 | Average $43,661 |