Hawaiian vs Paraguayan Per Capita Income
COMPARE
Hawaiian
Paraguayan
Per Capita Income
Per Capita Income Comparison
Hawaiians
Paraguayans
$39,403
PER CAPITA INCOME
0.8/ 100
METRIC RATING
256th/ 347
METRIC RANK
$50,385
PER CAPITA INCOME
99.9/ 100
METRIC RATING
53rd/ 347
METRIC RANK
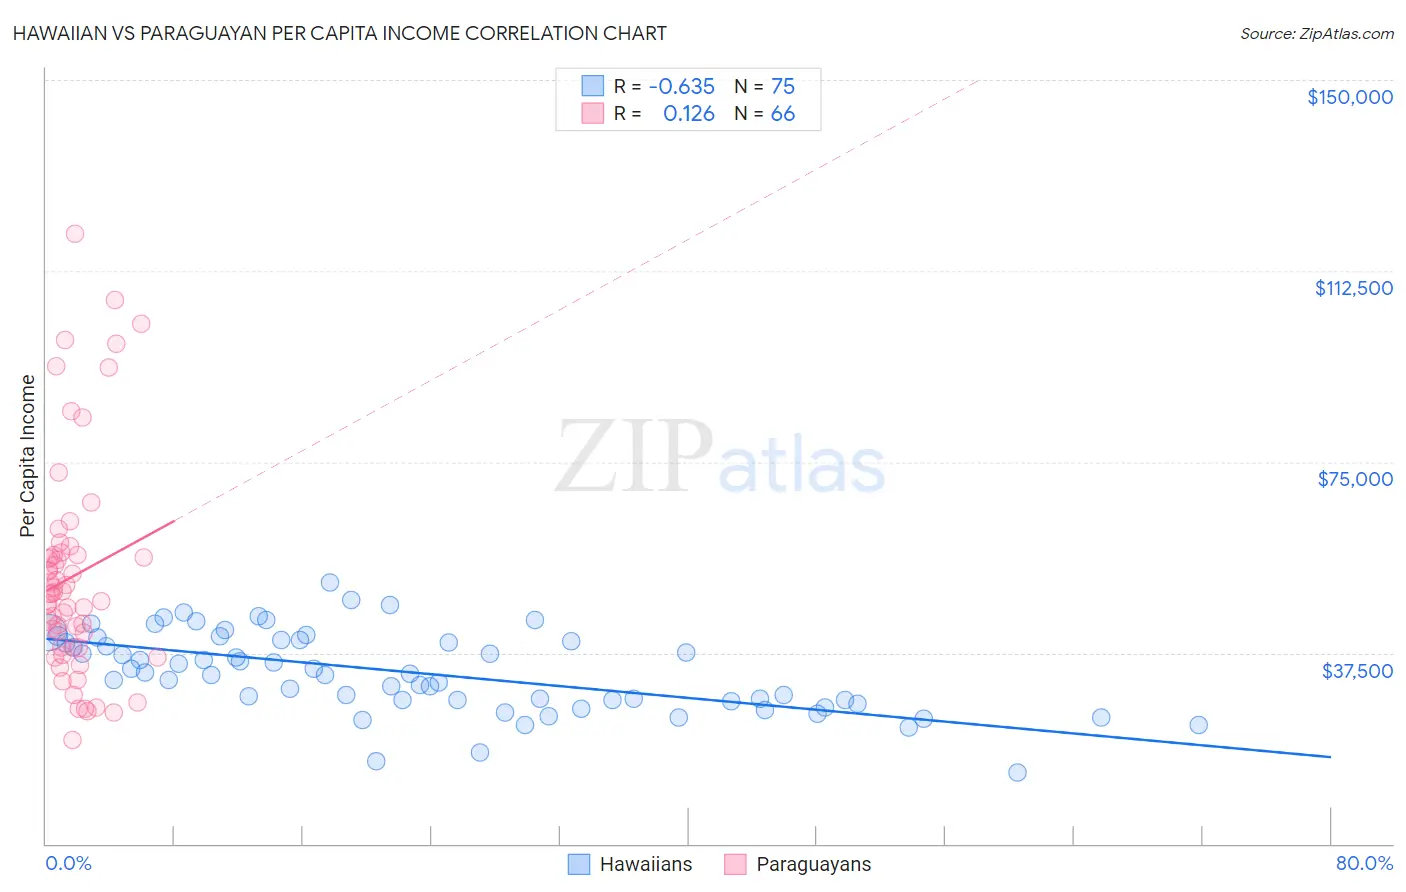
Hawaiian vs Paraguayan Per Capita Income Correlation Chart
The statistical analysis conducted on geographies consisting of 327,629,067 people shows a significant negative correlation between the proportion of Hawaiians and per capita income in the United States with a correlation coefficient (R) of -0.635 and weighted average of $39,403. Similarly, the statistical analysis conducted on geographies consisting of 95,089,637 people shows a poor positive correlation between the proportion of Paraguayans and per capita income in the United States with a correlation coefficient (R) of 0.126 and weighted average of $50,385, a difference of 27.9%.
Per Capita Income Correlation Summary
| Measurement | Hawaiian | Paraguayan |
| Minimum | $14,082 | $20,486 |
| Maximum | $51,335 | $119,781 |
| Range | $37,253 | $99,295 |
| Mean | $33,620 | $52,548 |
| Median | $33,340 | $49,067 |
| Interquartile 25% (IQ1) | $28,161 | $38,496 |
| Interquartile 75% (IQ3) | $40,110 | $56,770 |
| Interquartile Range (IQR) | $11,949 | $18,274 |
| Standard Deviation (Sample) | $7,838 | $21,489 |
| Standard Deviation (Population) | $7,785 | $21,325 |
Similar Demographics by Per Capita Income
Demographics Similar to Hawaiians by Per Capita Income
In terms of per capita income, the demographic groups most similar to Hawaiians are Nicaraguan ($39,372, a difference of 0.080%), Immigrants from Middle Africa ($39,529, a difference of 0.32%), Alaska Native ($39,558, a difference of 0.39%), Osage ($39,568, a difference of 0.42%), and Jamaican ($39,231, a difference of 0.44%).
| Demographics | Rating | Rank | Per Capita Income |
| Japanese | 1.4 /100 | #249 | Tragic $39,870 |
| Immigrants | Burma/Myanmar | 1.3 /100 | #250 | Tragic $39,827 |
| Samoans | 1.3 /100 | #251 | Tragic $39,826 |
| Immigrants | Azores | 1.0 /100 | #252 | Tragic $39,608 |
| Osage | 1.0 /100 | #253 | Tragic $39,568 |
| Alaska Natives | 1.0 /100 | #254 | Tragic $39,558 |
| Immigrants | Middle Africa | 1.0 /100 | #255 | Tragic $39,529 |
| Hawaiians | 0.8 /100 | #256 | Tragic $39,403 |
| Nicaraguans | 0.8 /100 | #257 | Tragic $39,372 |
| Jamaicans | 0.7 /100 | #258 | Tragic $39,231 |
| Malaysians | 0.7 /100 | #259 | Tragic $39,194 |
| Alaskan Athabascans | 0.6 /100 | #260 | Tragic $39,163 |
| Marshallese | 0.6 /100 | #261 | Tragic $39,108 |
| Iroquois | 0.6 /100 | #262 | Tragic $39,104 |
| Belizeans | 0.6 /100 | #263 | Tragic $39,097 |
Demographics Similar to Paraguayans by Per Capita Income
In terms of per capita income, the demographic groups most similar to Paraguayans are Immigrants from Croatia ($50,417, a difference of 0.060%), Immigrants from Netherlands ($50,458, a difference of 0.14%), Immigrants from Belarus ($50,303, a difference of 0.16%), Immigrants from Sri Lanka ($50,555, a difference of 0.34%), and New Zealander ($50,575, a difference of 0.38%).
| Demographics | Rating | Rank | Per Capita Income |
| Immigrants | Latvia | 100.0 /100 | #46 | Exceptional $50,914 |
| Bulgarians | 100.0 /100 | #47 | Exceptional $50,906 |
| Immigrants | Serbia | 100.0 /100 | #48 | Exceptional $50,810 |
| New Zealanders | 100.0 /100 | #49 | Exceptional $50,575 |
| Immigrants | Sri Lanka | 100.0 /100 | #50 | Exceptional $50,555 |
| Immigrants | Netherlands | 100.0 /100 | #51 | Exceptional $50,458 |
| Immigrants | Croatia | 99.9 /100 | #52 | Exceptional $50,417 |
| Paraguayans | 99.9 /100 | #53 | Exceptional $50,385 |
| Immigrants | Belarus | 99.9 /100 | #54 | Exceptional $50,303 |
| Immigrants | Western Europe | 99.9 /100 | #55 | Exceptional $50,065 |
| Asians | 99.9 /100 | #56 | Exceptional $50,057 |
| South Africans | 99.9 /100 | #57 | Exceptional $50,044 |
| Immigrants | Malaysia | 99.9 /100 | #58 | Exceptional $49,983 |
| Bhutanese | 99.9 /100 | #59 | Exceptional $49,894 |
| Immigrants | Scotland | 99.9 /100 | #60 | Exceptional $49,893 |