Haitian vs Immigrants from China Median Household Income
COMPARE
Haitian
Immigrants from China
Median Household Income
Median Household Income Comparison
Haitians
Immigrants from China
$73,306
MEDIAN HOUSEHOLD INCOME
0.1/ 100
METRIC RATING
296th/ 347
METRIC RANK
$105,335
MEDIAN HOUSEHOLD INCOME
100.0/ 100
METRIC RATING
11th/ 347
METRIC RANK
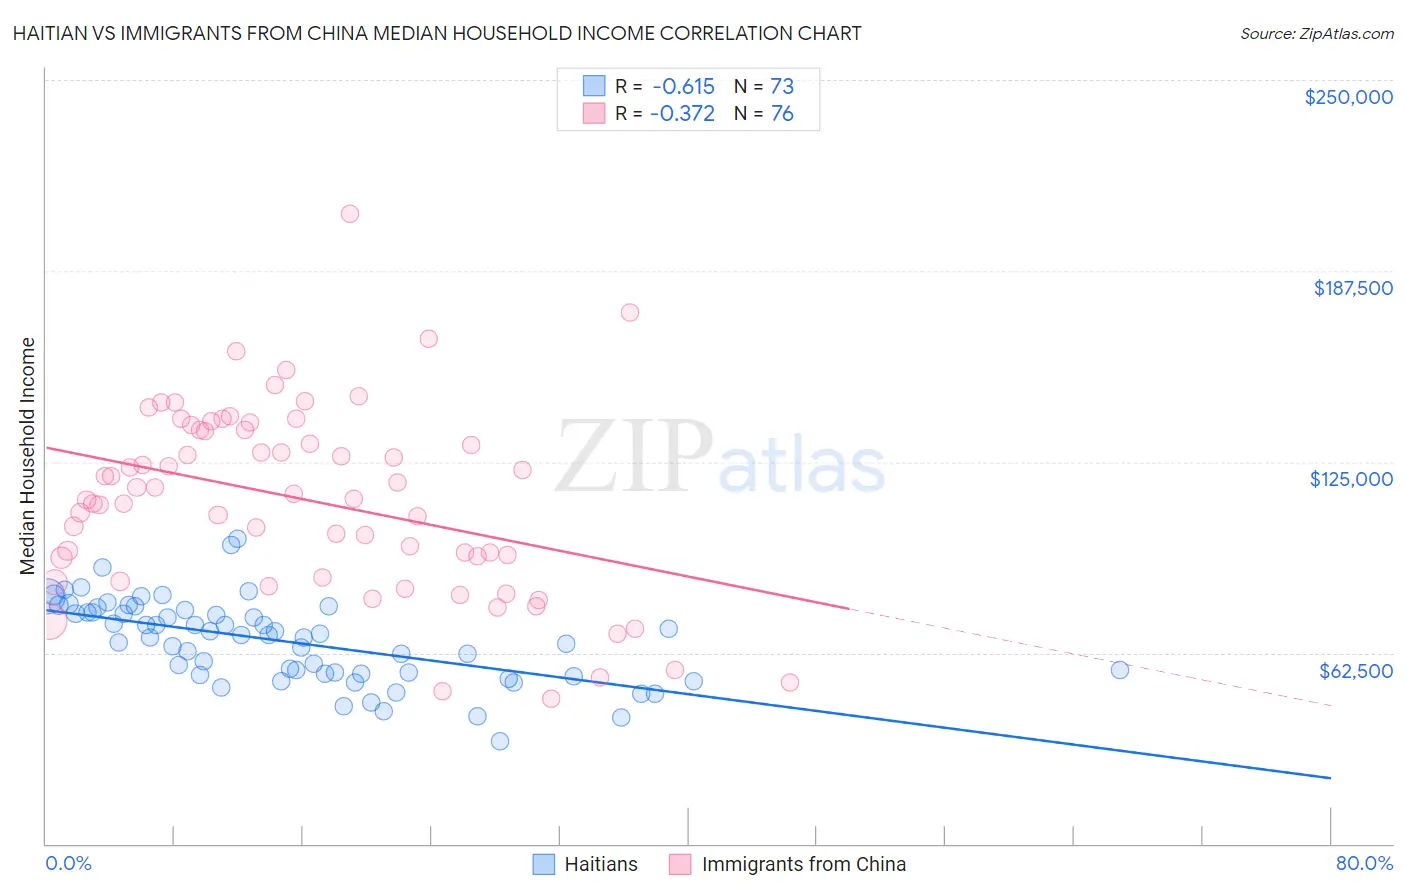
Haitian vs Immigrants from China Median Household Income Correlation Chart
The statistical analysis conducted on geographies consisting of 287,615,576 people shows a significant negative correlation between the proportion of Haitians and median household income in the United States with a correlation coefficient (R) of -0.615 and weighted average of $73,306. Similarly, the statistical analysis conducted on geographies consisting of 456,448,801 people shows a mild negative correlation between the proportion of Immigrants from China and median household income in the United States with a correlation coefficient (R) of -0.372 and weighted average of $105,335, a difference of 43.7%.
Median Household Income Correlation Summary
| Measurement | Haitian | Immigrants from China |
| Minimum | $33,629 | $47,386 |
| Maximum | $99,911 | $206,336 |
| Range | $66,282 | $158,950 |
| Mean | $66,249 | $112,457 |
| Median | $68,171 | $113,740 |
| Interquartile 25% (IQ1) | $55,796 | $90,379 |
| Interquartile 75% (IQ3) | $76,109 | $135,564 |
| Interquartile Range (IQR) | $20,312 | $45,185 |
| Standard Deviation (Sample) | $13,488 | $30,829 |
| Standard Deviation (Population) | $13,395 | $30,625 |
Similar Demographics by Median Household Income
Demographics Similar to Haitians by Median Household Income
In terms of median household income, the demographic groups most similar to Haitians are Cuban ($73,392, a difference of 0.12%), Immigrants from Mexico ($73,160, a difference of 0.20%), Blackfeet ($73,509, a difference of 0.28%), Immigrants from Cabo Verde ($73,515, a difference of 0.29%), and Paiute ($72,959, a difference of 0.48%).
| Demographics | Rating | Rank | Median Household Income |
| Fijians | 0.1 /100 | #289 | Tragic $74,205 |
| Bangladeshis | 0.1 /100 | #290 | Tragic $74,112 |
| Hispanics or Latinos | 0.1 /100 | #291 | Tragic $73,823 |
| Comanche | 0.1 /100 | #292 | Tragic $73,747 |
| Immigrants | Cabo Verde | 0.1 /100 | #293 | Tragic $73,515 |
| Blackfeet | 0.1 /100 | #294 | Tragic $73,509 |
| Cubans | 0.1 /100 | #295 | Tragic $73,392 |
| Haitians | 0.1 /100 | #296 | Tragic $73,306 |
| Immigrants | Mexico | 0.0 /100 | #297 | Tragic $73,160 |
| Paiute | 0.0 /100 | #298 | Tragic $72,959 |
| Indonesians | 0.0 /100 | #299 | Tragic $72,856 |
| Immigrants | Dominica | 0.0 /100 | #300 | Tragic $72,760 |
| Cherokee | 0.0 /100 | #301 | Tragic $72,682 |
| Shoshone | 0.0 /100 | #302 | Tragic $72,660 |
| Africans | 0.0 /100 | #303 | Tragic $72,650 |
Demographics Similar to Immigrants from China by Median Household Income
In terms of median household income, the demographic groups most similar to Immigrants from China are Indian (Asian) ($105,262, a difference of 0.070%), Immigrants from Eastern Asia ($104,796, a difference of 0.51%), Immigrants from Ireland ($104,692, a difference of 0.61%), Immigrants from South Central Asia ($106,057, a difference of 0.69%), and Immigrants from Israel ($104,090, a difference of 1.2%).
| Demographics | Rating | Rank | Median Household Income |
| Immigrants | Hong Kong | 100.0 /100 | #4 | Exceptional $111,519 |
| Thais | 100.0 /100 | #5 | Exceptional $110,648 |
| Immigrants | Singapore | 100.0 /100 | #6 | Exceptional $110,428 |
| Iranians | 100.0 /100 | #7 | Exceptional $109,835 |
| Immigrants | Iran | 100.0 /100 | #8 | Exceptional $108,055 |
| Okinawans | 100.0 /100 | #9 | Exceptional $106,624 |
| Immigrants | South Central Asia | 100.0 /100 | #10 | Exceptional $106,057 |
| Immigrants | China | 100.0 /100 | #11 | Exceptional $105,335 |
| Indians (Asian) | 100.0 /100 | #12 | Exceptional $105,262 |
| Immigrants | Eastern Asia | 100.0 /100 | #13 | Exceptional $104,796 |
| Immigrants | Ireland | 100.0 /100 | #14 | Exceptional $104,692 |
| Immigrants | Israel | 100.0 /100 | #15 | Exceptional $104,090 |
| Burmese | 100.0 /100 | #16 | Exceptional $103,145 |
| Immigrants | Korea | 100.0 /100 | #17 | Exceptional $102,962 |
| Cypriots | 100.0 /100 | #18 | Exceptional $102,843 |