Haitian vs Immigrants from Nigeria Median Household Income
COMPARE
Haitian
Immigrants from Nigeria
Median Household Income
Median Household Income Comparison
Haitians
Immigrants from Nigeria
$73,306
MEDIAN HOUSEHOLD INCOME
0.1/ 100
METRIC RATING
296th/ 347
METRIC RANK
$81,236
MEDIAN HOUSEHOLD INCOME
7.7/ 100
METRIC RATING
222nd/ 347
METRIC RANK
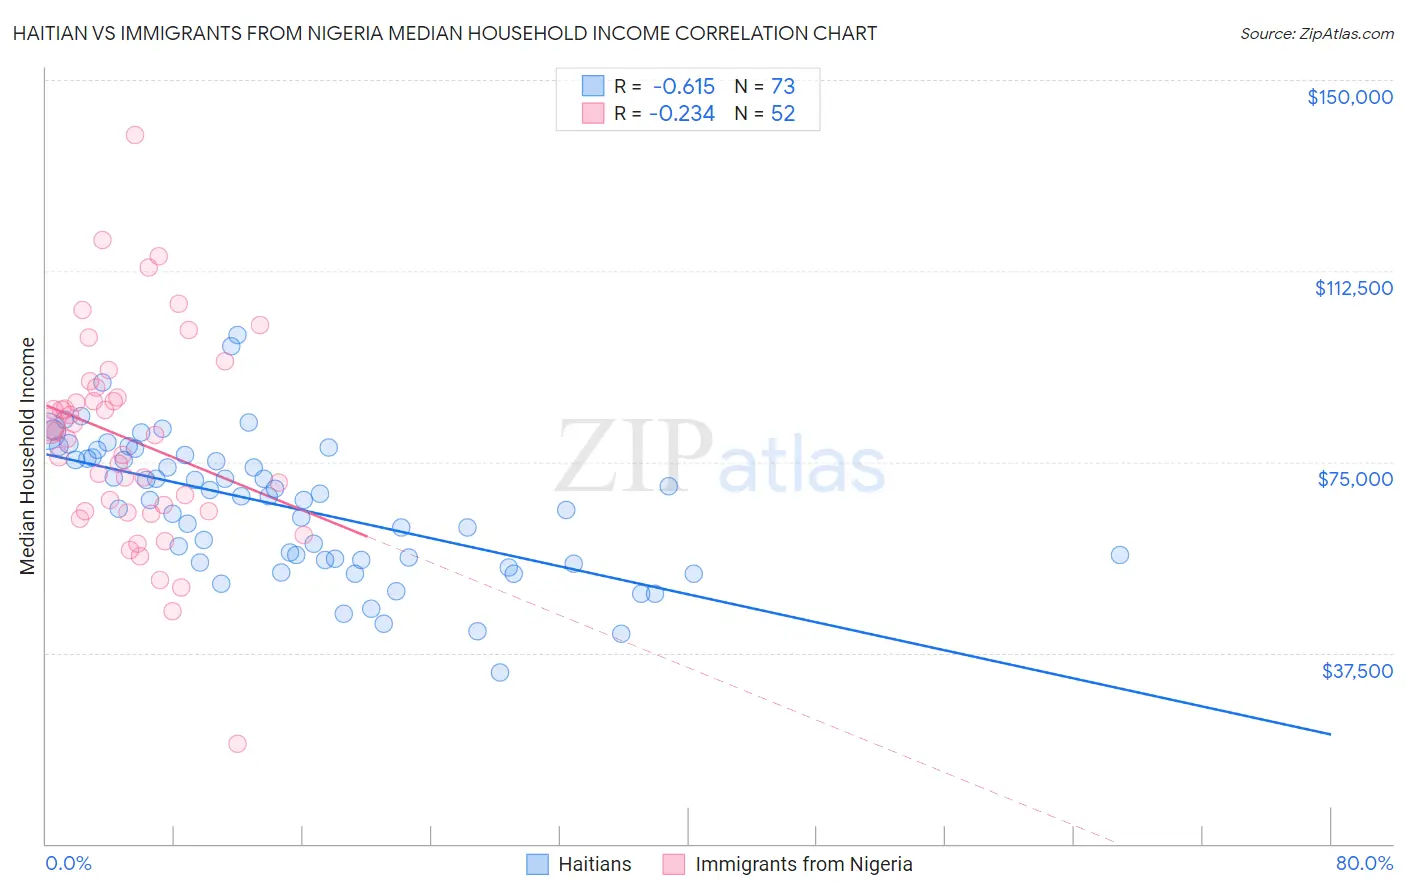
Haitian vs Immigrants from Nigeria Median Household Income Correlation Chart
The statistical analysis conducted on geographies consisting of 287,615,576 people shows a significant negative correlation between the proportion of Haitians and median household income in the United States with a correlation coefficient (R) of -0.615 and weighted average of $73,306. Similarly, the statistical analysis conducted on geographies consisting of 283,225,999 people shows a weak negative correlation between the proportion of Immigrants from Nigeria and median household income in the United States with a correlation coefficient (R) of -0.234 and weighted average of $81,236, a difference of 10.8%.
Median Household Income Correlation Summary
| Measurement | Haitian | Immigrants from Nigeria |
| Minimum | $33,629 | $19,722 |
| Maximum | $99,911 | $139,152 |
| Range | $66,282 | $119,430 |
| Mean | $66,249 | $79,398 |
| Median | $68,171 | $80,475 |
| Interquartile 25% (IQ1) | $55,796 | $65,224 |
| Interquartile 75% (IQ3) | $76,109 | $88,599 |
| Interquartile Range (IQR) | $20,312 | $23,375 |
| Standard Deviation (Sample) | $13,488 | $20,570 |
| Standard Deviation (Population) | $13,395 | $20,371 |
Similar Demographics by Median Household Income
Demographics Similar to Haitians by Median Household Income
In terms of median household income, the demographic groups most similar to Haitians are Cuban ($73,392, a difference of 0.12%), Immigrants from Mexico ($73,160, a difference of 0.20%), Blackfeet ($73,509, a difference of 0.28%), Immigrants from Cabo Verde ($73,515, a difference of 0.29%), and Paiute ($72,959, a difference of 0.48%).
| Demographics | Rating | Rank | Median Household Income |
| Fijians | 0.1 /100 | #289 | Tragic $74,205 |
| Bangladeshis | 0.1 /100 | #290 | Tragic $74,112 |
| Hispanics or Latinos | 0.1 /100 | #291 | Tragic $73,823 |
| Comanche | 0.1 /100 | #292 | Tragic $73,747 |
| Immigrants | Cabo Verde | 0.1 /100 | #293 | Tragic $73,515 |
| Blackfeet | 0.1 /100 | #294 | Tragic $73,509 |
| Cubans | 0.1 /100 | #295 | Tragic $73,392 |
| Haitians | 0.1 /100 | #296 | Tragic $73,306 |
| Immigrants | Mexico | 0.0 /100 | #297 | Tragic $73,160 |
| Paiute | 0.0 /100 | #298 | Tragic $72,959 |
| Indonesians | 0.0 /100 | #299 | Tragic $72,856 |
| Immigrants | Dominica | 0.0 /100 | #300 | Tragic $72,760 |
| Cherokee | 0.0 /100 | #301 | Tragic $72,682 |
| Shoshone | 0.0 /100 | #302 | Tragic $72,660 |
| Africans | 0.0 /100 | #303 | Tragic $72,650 |
Demographics Similar to Immigrants from Nigeria by Median Household Income
In terms of median household income, the demographic groups most similar to Immigrants from Nigeria are Immigrants from El Salvador ($81,213, a difference of 0.030%), Malaysian ($81,064, a difference of 0.21%), Immigrants from Ghana ($81,489, a difference of 0.31%), Immigrants from Venezuela ($81,506, a difference of 0.33%), and Scotch-Irish ($80,972, a difference of 0.33%).
| Demographics | Rating | Rank | Median Household Income |
| Vietnamese | 13.8 /100 | #215 | Poor $82,248 |
| Yugoslavians | 13.3 /100 | #216 | Poor $82,186 |
| Ecuadorians | 12.5 /100 | #217 | Poor $82,070 |
| Whites/Caucasians | 12.2 /100 | #218 | Poor $82,029 |
| Nigerians | 10.3 /100 | #219 | Poor $81,725 |
| Immigrants | Venezuela | 9.0 /100 | #220 | Tragic $81,506 |
| Immigrants | Ghana | 9.0 /100 | #221 | Tragic $81,489 |
| Immigrants | Nigeria | 7.7 /100 | #222 | Tragic $81,236 |
| Immigrants | El Salvador | 7.6 /100 | #223 | Tragic $81,213 |
| Malaysians | 7.0 /100 | #224 | Tragic $81,064 |
| Scotch-Irish | 6.6 /100 | #225 | Tragic $80,972 |
| Immigrants | Panama | 6.2 /100 | #226 | Tragic $80,873 |
| Guyanese | 5.7 /100 | #227 | Tragic $80,734 |
| Immigrants | Bangladesh | 5.7 /100 | #228 | Tragic $80,722 |
| Delaware | 5.0 /100 | #229 | Tragic $80,527 |