Haitian vs Chilean Median Household Income
COMPARE
Haitian
Chilean
Median Household Income
Median Household Income Comparison
Haitians
Chileans
$73,306
MEDIAN HOUSEHOLD INCOME
0.1/ 100
METRIC RATING
296th/ 347
METRIC RANK
$90,605
MEDIAN HOUSEHOLD INCOME
97.2/ 100
METRIC RATING
109th/ 347
METRIC RANK
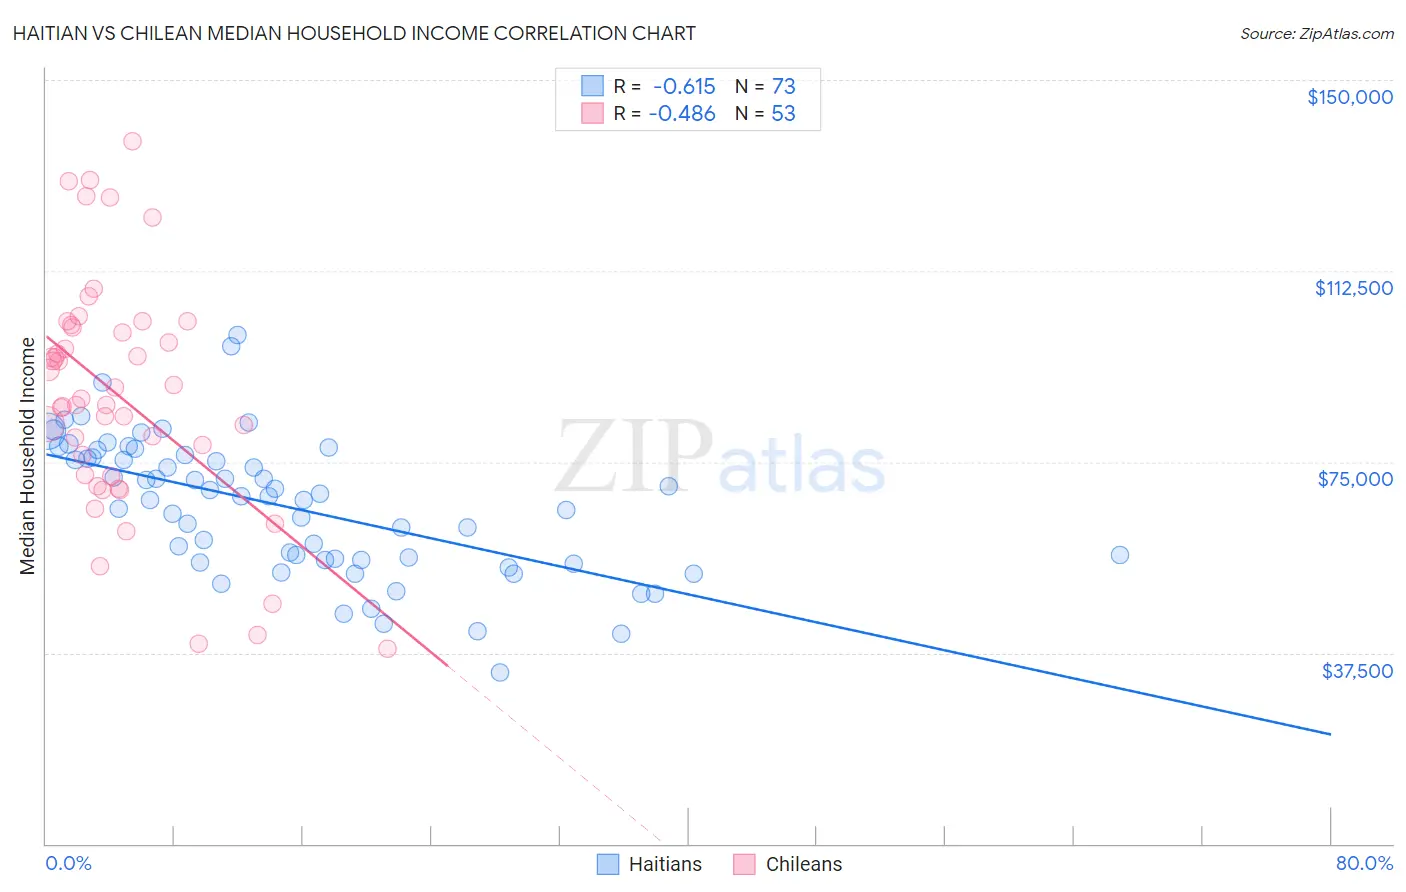
Haitian vs Chilean Median Household Income Correlation Chart
The statistical analysis conducted on geographies consisting of 287,615,576 people shows a significant negative correlation between the proportion of Haitians and median household income in the United States with a correlation coefficient (R) of -0.615 and weighted average of $73,306. Similarly, the statistical analysis conducted on geographies consisting of 256,490,750 people shows a moderate negative correlation between the proportion of Chileans and median household income in the United States with a correlation coefficient (R) of -0.486 and weighted average of $90,605, a difference of 23.6%.
Median Household Income Correlation Summary
| Measurement | Haitian | Chilean |
| Minimum | $33,629 | $38,281 |
| Maximum | $99,911 | $138,054 |
| Range | $66,282 | $99,773 |
| Mean | $66,249 | $87,931 |
| Median | $68,171 | $87,519 |
| Interquartile 25% (IQ1) | $55,796 | $72,343 |
| Interquartile 75% (IQ3) | $76,109 | $101,615 |
| Interquartile Range (IQR) | $20,312 | $29,272 |
| Standard Deviation (Sample) | $13,488 | $22,824 |
| Standard Deviation (Population) | $13,395 | $22,607 |
Similar Demographics by Median Household Income
Demographics Similar to Haitians by Median Household Income
In terms of median household income, the demographic groups most similar to Haitians are Cuban ($73,392, a difference of 0.12%), Immigrants from Mexico ($73,160, a difference of 0.20%), Blackfeet ($73,509, a difference of 0.28%), Immigrants from Cabo Verde ($73,515, a difference of 0.29%), and Paiute ($72,959, a difference of 0.48%).
| Demographics | Rating | Rank | Median Household Income |
| Fijians | 0.1 /100 | #289 | Tragic $74,205 |
| Bangladeshis | 0.1 /100 | #290 | Tragic $74,112 |
| Hispanics or Latinos | 0.1 /100 | #291 | Tragic $73,823 |
| Comanche | 0.1 /100 | #292 | Tragic $73,747 |
| Immigrants | Cabo Verde | 0.1 /100 | #293 | Tragic $73,515 |
| Blackfeet | 0.1 /100 | #294 | Tragic $73,509 |
| Cubans | 0.1 /100 | #295 | Tragic $73,392 |
| Haitians | 0.1 /100 | #296 | Tragic $73,306 |
| Immigrants | Mexico | 0.0 /100 | #297 | Tragic $73,160 |
| Paiute | 0.0 /100 | #298 | Tragic $72,959 |
| Indonesians | 0.0 /100 | #299 | Tragic $72,856 |
| Immigrants | Dominica | 0.0 /100 | #300 | Tragic $72,760 |
| Cherokee | 0.0 /100 | #301 | Tragic $72,682 |
| Shoshone | 0.0 /100 | #302 | Tragic $72,660 |
| Africans | 0.0 /100 | #303 | Tragic $72,650 |
Demographics Similar to Chileans by Median Household Income
In terms of median household income, the demographic groups most similar to Chileans are Zimbabwean ($90,618, a difference of 0.020%), Palestinian ($90,574, a difference of 0.030%), Immigrants from Poland ($90,549, a difference of 0.060%), Croatian ($90,685, a difference of 0.090%), and Macedonian ($90,761, a difference of 0.17%).
| Demographics | Rating | Rank | Median Household Income |
| Austrians | 98.2 /100 | #102 | Exceptional $91,339 |
| Immigrants | Ukraine | 98.0 /100 | #103 | Exceptional $91,124 |
| Immigrants | Kazakhstan | 97.8 /100 | #104 | Exceptional $91,015 |
| Immigrants | Brazil | 97.7 /100 | #105 | Exceptional $90,907 |
| Macedonians | 97.4 /100 | #106 | Exceptional $90,761 |
| Croatians | 97.3 /100 | #107 | Exceptional $90,685 |
| Zimbabweans | 97.2 /100 | #108 | Exceptional $90,618 |
| Chileans | 97.2 /100 | #109 | Exceptional $90,605 |
| Palestinians | 97.1 /100 | #110 | Exceptional $90,574 |
| Immigrants | Poland | 97.1 /100 | #111 | Exceptional $90,549 |
| Northern Europeans | 96.9 /100 | #112 | Exceptional $90,446 |
| Peruvians | 96.5 /100 | #113 | Exceptional $90,261 |
| Immigrants | Northern Africa | 95.9 /100 | #114 | Exceptional $90,026 |
| Immigrants | Western Asia | 95.9 /100 | #115 | Exceptional $90,005 |
| Native Hawaiians | 95.7 /100 | #116 | Exceptional $89,919 |