Immigrants from Grenada vs Potawatomi Median Earnings
COMPARE
Immigrants from Grenada
Potawatomi
Median Earnings
Median Earnings Comparison
Immigrants from Grenada
Potawatomi
$45,596
MEDIAN EARNINGS
23.6/ 100
METRIC RATING
210th/ 347
METRIC RANK
$41,288
MEDIAN EARNINGS
0.1/ 100
METRIC RATING
294th/ 347
METRIC RANK
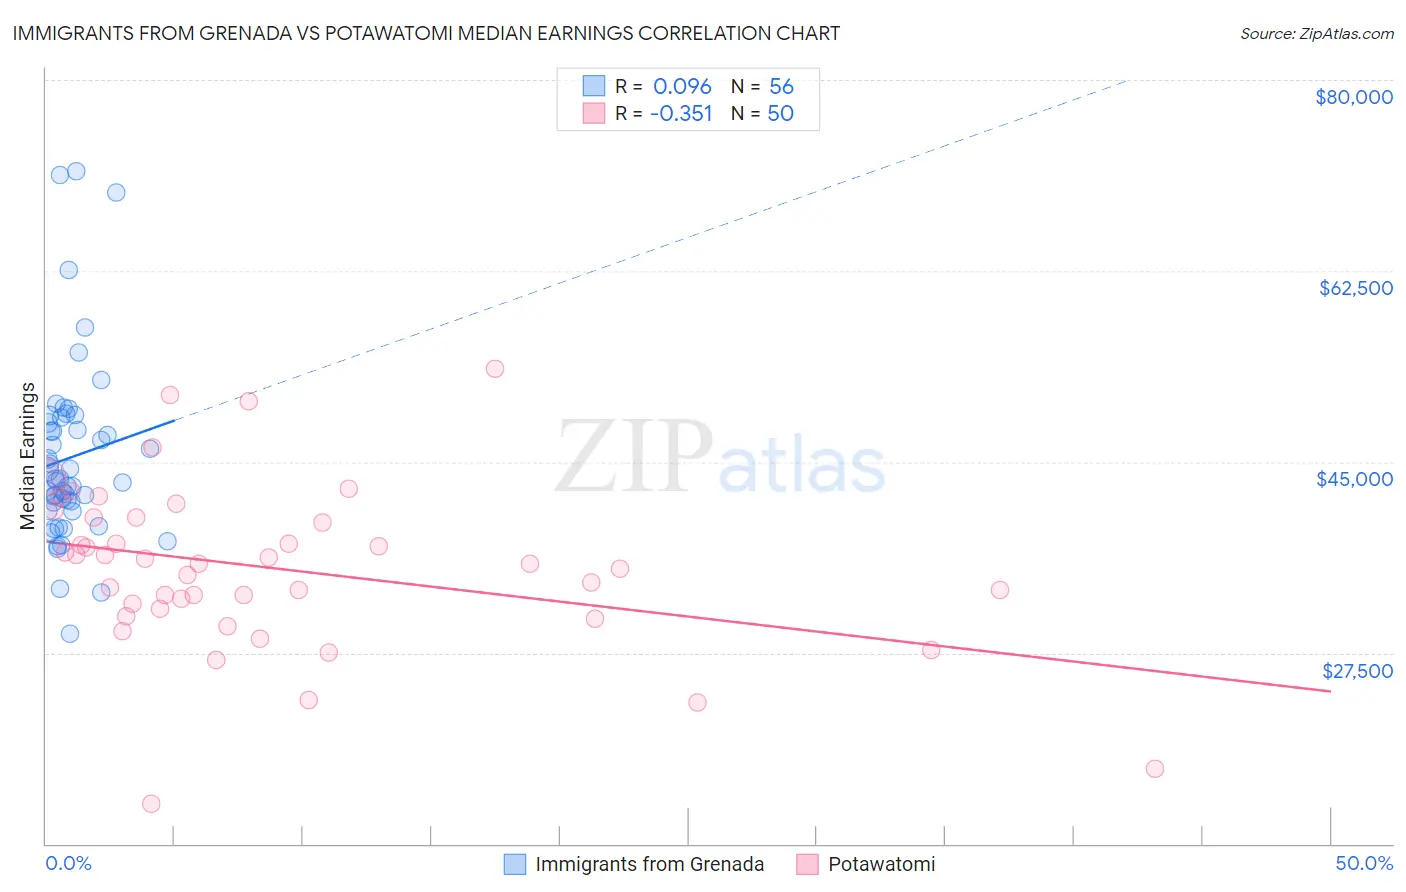
Immigrants from Grenada vs Potawatomi Median Earnings Correlation Chart
The statistical analysis conducted on geographies consisting of 67,199,447 people shows a slight positive correlation between the proportion of Immigrants from Grenada and median earnings in the United States with a correlation coefficient (R) of 0.096 and weighted average of $45,596. Similarly, the statistical analysis conducted on geographies consisting of 117,770,629 people shows a mild negative correlation between the proportion of Potawatomi and median earnings in the United States with a correlation coefficient (R) of -0.351 and weighted average of $41,288, a difference of 10.4%.
Median Earnings Correlation Summary
| Measurement | Immigrants from Grenada | Potawatomi |
| Minimum | $29,237 | $13,611 |
| Maximum | $71,671 | $53,523 |
| Range | $42,434 | $39,912 |
| Mean | $45,405 | $35,226 |
| Median | $43,368 | $35,630 |
| Interquartile 25% (IQ1) | $40,879 | $31,586 |
| Interquartile 75% (IQ3) | $48,789 | $39,871 |
| Interquartile Range (IQR) | $7,911 | $8,285 |
| Standard Deviation (Sample) | $8,458 | $7,629 |
| Standard Deviation (Population) | $8,382 | $7,552 |
Similar Demographics by Median Earnings
Demographics Similar to Immigrants from Grenada by Median Earnings
In terms of median earnings, the demographic groups most similar to Immigrants from Grenada are Immigrants from Thailand ($45,598, a difference of 0.0%), Immigrants from Bosnia and Herzegovina ($45,600, a difference of 0.010%), Panamanian ($45,593, a difference of 0.010%), Bermudan ($45,593, a difference of 0.010%), and Immigrants from Senegal ($45,611, a difference of 0.030%).
| Demographics | Rating | Rank | Median Earnings |
| Welsh | 26.6 /100 | #203 | Fair $45,710 |
| Immigrants | Uruguay | 25.9 /100 | #204 | Fair $45,682 |
| Tongans | 25.4 /100 | #205 | Fair $45,665 |
| Immigrants | Ghana | 24.8 /100 | #206 | Fair $45,641 |
| Immigrants | Senegal | 24.0 /100 | #207 | Fair $45,611 |
| Immigrants | Bosnia and Herzegovina | 23.7 /100 | #208 | Fair $45,600 |
| Immigrants | Thailand | 23.7 /100 | #209 | Fair $45,598 |
| Immigrants | Grenada | 23.6 /100 | #210 | Fair $45,596 |
| Panamanians | 23.5 /100 | #211 | Fair $45,593 |
| Bermudans | 23.5 /100 | #212 | Fair $45,593 |
| Immigrants | Colombia | 22.4 /100 | #213 | Fair $45,550 |
| Nigerians | 22.0 /100 | #214 | Fair $45,532 |
| Immigrants | Bangladesh | 22.0 /100 | #215 | Fair $45,532 |
| Guyanese | 20.6 /100 | #216 | Fair $45,470 |
| Tlingit-Haida | 20.5 /100 | #217 | Fair $45,468 |
Demographics Similar to Potawatomi by Median Earnings
In terms of median earnings, the demographic groups most similar to Potawatomi are Bangladeshi ($41,263, a difference of 0.060%), Immigrants from Zaire ($41,325, a difference of 0.090%), Cherokee ($41,252, a difference of 0.090%), Guatemalan ($41,205, a difference of 0.20%), and Immigrants from Micronesia ($41,133, a difference of 0.38%).
| Demographics | Rating | Rank | Median Earnings |
| Indonesians | 0.1 /100 | #287 | Tragic $41,701 |
| Immigrants | Dominican Republic | 0.1 /100 | #288 | Tragic $41,554 |
| Comanche | 0.1 /100 | #289 | Tragic $41,519 |
| Paiute | 0.1 /100 | #290 | Tragic $41,508 |
| Central American Indians | 0.1 /100 | #291 | Tragic $41,474 |
| U.S. Virgin Islanders | 0.1 /100 | #292 | Tragic $41,448 |
| Immigrants | Zaire | 0.1 /100 | #293 | Tragic $41,325 |
| Potawatomi | 0.1 /100 | #294 | Tragic $41,288 |
| Bangladeshis | 0.1 /100 | #295 | Tragic $41,263 |
| Cherokee | 0.1 /100 | #296 | Tragic $41,252 |
| Guatemalans | 0.1 /100 | #297 | Tragic $41,205 |
| Immigrants | Micronesia | 0.1 /100 | #298 | Tragic $41,133 |
| Immigrants | Caribbean | 0.1 /100 | #299 | Tragic $41,119 |
| Ute | 0.1 /100 | #300 | Tragic $41,051 |
| Immigrants | Latin America | 0.1 /100 | #301 | Tragic $41,049 |