Guyanese vs Spanish American Householder Income Over 65 years
COMPARE
Guyanese
Spanish American
Householder Income Over 65 years
Householder Income Over 65 years Comparison
Guyanese
Spanish Americans
$56,351
HOUSEHOLDER INCOME OVER 65 YEARS
0.8/ 100
METRIC RATING
243rd/ 347
METRIC RANK
$57,021
HOUSEHOLDER INCOME OVER 65 YEARS
1.6/ 100
METRIC RATING
235th/ 347
METRIC RANK
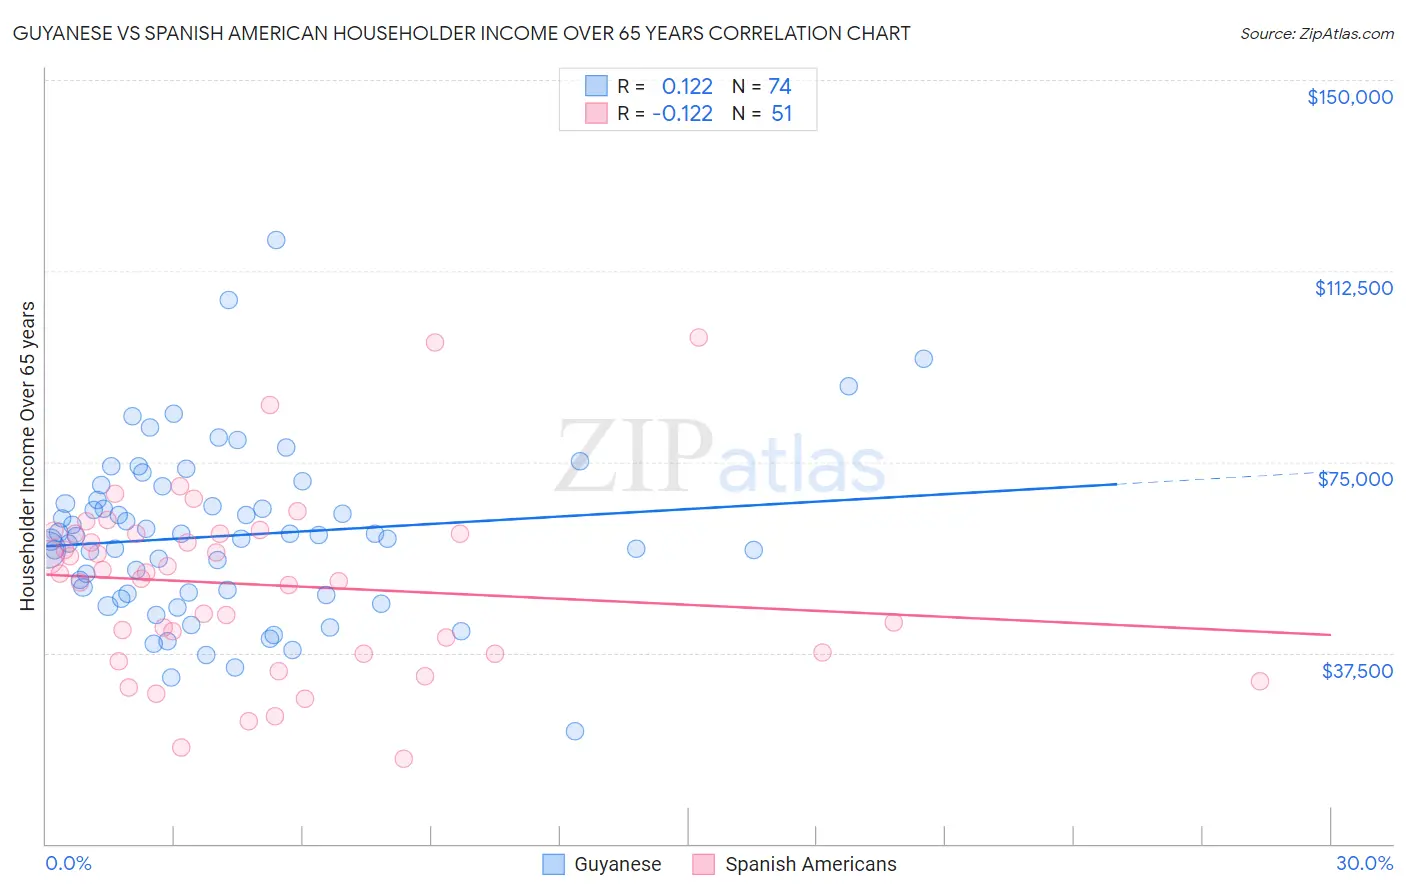
Guyanese vs Spanish American Householder Income Over 65 years Correlation Chart
The statistical analysis conducted on geographies consisting of 176,487,050 people shows a poor positive correlation between the proportion of Guyanese and household income with householder over the age of 65 in the United States with a correlation coefficient (R) of 0.122 and weighted average of $56,351. Similarly, the statistical analysis conducted on geographies consisting of 103,119,527 people shows a poor negative correlation between the proportion of Spanish Americans and household income with householder over the age of 65 in the United States with a correlation coefficient (R) of -0.122 and weighted average of $57,021, a difference of 1.2%.
Householder Income Over 65 years Correlation Summary
| Measurement | Guyanese | Spanish American |
| Minimum | $22,090 | $16,667 |
| Maximum | $118,508 | $99,316 |
| Range | $96,418 | $82,649 |
| Mean | $60,484 | $50,862 |
| Median | $60,185 | $53,029 |
| Interquartile 25% (IQ1) | $49,040 | $37,400 |
| Interquartile 75% (IQ3) | $67,479 | $60,833 |
| Interquartile Range (IQR) | $18,439 | $23,433 |
| Standard Deviation (Sample) | $16,619 | $17,582 |
| Standard Deviation (Population) | $16,506 | $17,409 |
Demographics Similar to Guyanese and Spanish Americans by Householder Income Over 65 years
In terms of householder income over 65 years, the demographic groups most similar to Guyanese are Hmong ($56,339, a difference of 0.020%), Immigrants from Uzbekistan ($56,331, a difference of 0.040%), Central American ($56,321, a difference of 0.050%), Yaqui ($56,417, a difference of 0.12%), and Yakama ($56,234, a difference of 0.21%). Similarly, the demographic groups most similar to Spanish Americans are Immigrants from Uruguay ($56,975, a difference of 0.080%), Immigrants from Panama ($56,944, a difference of 0.14%), Immigrants from Burma/Myanmar ($57,114, a difference of 0.16%), Immigrants from Western Africa ($57,119, a difference of 0.17%), and Fijian ($56,768, a difference of 0.45%).
| Demographics | Rating | Rank | Householder Income Over 65 years |
| Immigrants | Colombia | 3.0 /100 | #229 | Tragic $57,658 |
| Immigrants | Cambodia | 2.8 /100 | #230 | Tragic $57,580 |
| Immigrants | Nonimmigrants | 2.4 /100 | #231 | Tragic $57,426 |
| Immigrants | Venezuela | 2.3 /100 | #232 | Tragic $57,371 |
| Immigrants | Western Africa | 1.7 /100 | #233 | Tragic $57,119 |
| Immigrants | Burma/Myanmar | 1.7 /100 | #234 | Tragic $57,114 |
| Spanish Americans | 1.6 /100 | #235 | Tragic $57,021 |
| Immigrants | Uruguay | 1.5 /100 | #236 | Tragic $56,975 |
| Immigrants | Panama | 1.5 /100 | #237 | Tragic $56,944 |
| Fijians | 1.2 /100 | #238 | Tragic $56,768 |
| Immigrants | Laos | 1.2 /100 | #239 | Tragic $56,722 |
| Sub-Saharan Africans | 1.0 /100 | #240 | Tragic $56,615 |
| Immigrants | Guyana | 0.9 /100 | #241 | Tragic $56,495 |
| Yaqui | 0.8 /100 | #242 | Tragic $56,417 |
| Guyanese | 0.8 /100 | #243 | Tragic $56,351 |
| Hmong | 0.8 /100 | #244 | Tragic $56,339 |
| Immigrants | Uzbekistan | 0.8 /100 | #245 | Tragic $56,331 |
| Central Americans | 0.8 /100 | #246 | Tragic $56,321 |
| Yakama | 0.7 /100 | #247 | Tragic $56,234 |
| Vietnamese | 0.6 /100 | #248 | Tragic $56,143 |
| Mexican American Indians | 0.6 /100 | #249 | Tragic $56,089 |