Guatemalan vs Immigrants from Scotland Divorced or Separated
COMPARE
Guatemalan
Immigrants from Scotland
Divorced or Separated
Divorced or Separated Comparison
Guatemalans
Immigrants from Scotland
12.2%
DIVORCED OR SEPARATED
26.9/ 100
METRIC RATING
201st/ 347
METRIC RANK
12.0%
DIVORCED OR SEPARATED
65.8/ 100
METRIC RATING
160th/ 347
METRIC RANK
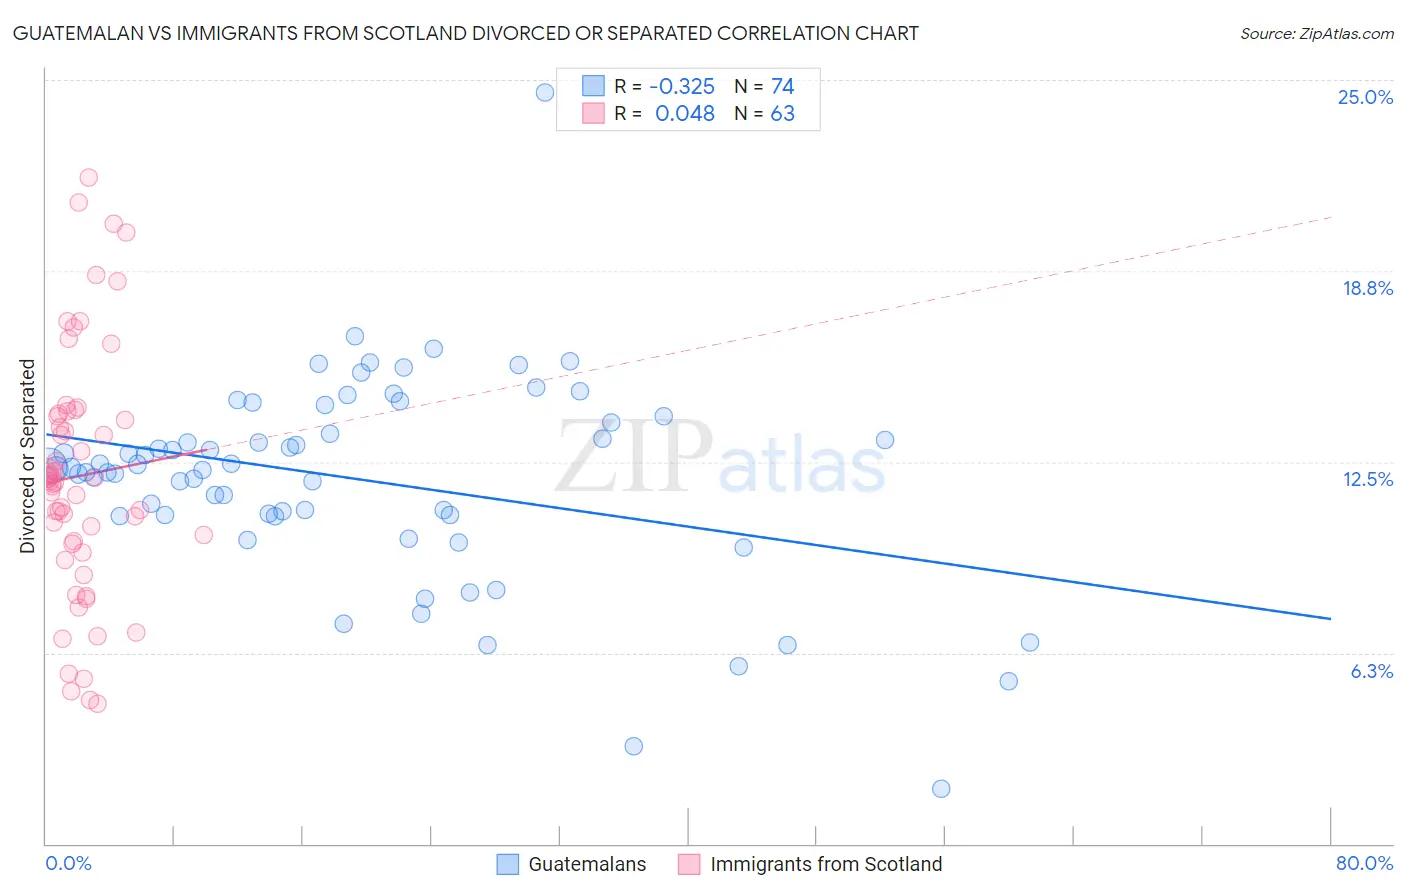
Guatemalan vs Immigrants from Scotland Divorced or Separated Correlation Chart
The statistical analysis conducted on geographies consisting of 409,404,182 people shows a mild negative correlation between the proportion of Guatemalans and percentage of population currently divorced or separated in the United States with a correlation coefficient (R) of -0.325 and weighted average of 12.2%. Similarly, the statistical analysis conducted on geographies consisting of 196,385,271 people shows no correlation between the proportion of Immigrants from Scotland and percentage of population currently divorced or separated in the United States with a correlation coefficient (R) of 0.048 and weighted average of 12.0%, a difference of 1.4%.
Divorced or Separated Correlation Summary
| Measurement | Guatemalan | Immigrants from Scotland |
| Minimum | 1.8% | 4.6% |
| Maximum | 24.6% | 21.8% |
| Range | 22.8% | 17.2% |
| Mean | 11.9% | 12.0% |
| Median | 12.3% | 11.9% |
| Interquartile 25% (IQ1) | 10.8% | 9.8% |
| Interquartile 75% (IQ3) | 13.8% | 14.1% |
| Interquartile Range (IQR) | 3.0% | 4.2% |
| Standard Deviation (Sample) | 3.4% | 4.0% |
| Standard Deviation (Population) | 3.3% | 4.0% |
Similar Demographics by Divorced or Separated
Demographics Similar to Guatemalans by Divorced or Separated
In terms of divorced or separated, the demographic groups most similar to Guatemalans are South American (12.2%, a difference of 0.070%), Central American (12.1%, a difference of 0.10%), Nigerian (12.1%, a difference of 0.14%), Immigrants from Burma/Myanmar (12.1%, a difference of 0.15%), and Immigrants from Africa (12.1%, a difference of 0.15%).
| Demographics | Rating | Rank | Divorced or Separated |
| Immigrants | Eritrea | 31.9 /100 | #194 | Fair 12.1% |
| Immigrants | England | 31.4 /100 | #195 | Fair 12.1% |
| Immigrants | Burma/Myanmar | 30.4 /100 | #196 | Fair 12.1% |
| Immigrants | Africa | 30.3 /100 | #197 | Fair 12.1% |
| Nigerians | 30.1 /100 | #198 | Fair 12.1% |
| Central Americans | 29.4 /100 | #199 | Fair 12.1% |
| South Americans | 28.6 /100 | #200 | Fair 12.2% |
| Guatemalans | 26.9 /100 | #201 | Fair 12.2% |
| Portuguese | 23.5 /100 | #202 | Fair 12.2% |
| Immigrants | Guatemala | 23.2 /100 | #203 | Fair 12.2% |
| Kenyans | 21.8 /100 | #204 | Fair 12.2% |
| Immigrants | Costa Rica | 21.3 /100 | #205 | Fair 12.2% |
| Slovaks | 21.0 /100 | #206 | Fair 12.2% |
| Mexicans | 21.0 /100 | #207 | Fair 12.2% |
| Immigrants | Ghana | 18.8 /100 | #208 | Poor 12.2% |
Demographics Similar to Immigrants from Scotland by Divorced or Separated
In terms of divorced or separated, the demographic groups most similar to Immigrants from Scotland are Icelander (12.0%, a difference of 0.010%), Immigrants from Barbados (12.0%, a difference of 0.010%), Marshallese (12.0%, a difference of 0.040%), Samoan (12.0%, a difference of 0.060%), and Navajo (12.0%, a difference of 0.070%).
| Demographics | Rating | Rank | Divorced or Separated |
| Austrians | 72.2 /100 | #153 | Good 12.0% |
| Chileans | 71.3 /100 | #154 | Good 12.0% |
| Japanese | 70.9 /100 | #155 | Good 12.0% |
| Hungarians | 70.3 /100 | #156 | Good 12.0% |
| Immigrants | Brazil | 68.8 /100 | #157 | Good 12.0% |
| Icelanders | 66.0 /100 | #158 | Good 12.0% |
| Immigrants | Barbados | 66.0 /100 | #159 | Good 12.0% |
| Immigrants | Scotland | 65.8 /100 | #160 | Good 12.0% |
| Marshallese | 64.6 /100 | #161 | Good 12.0% |
| Samoans | 64.3 /100 | #162 | Good 12.0% |
| Navajo | 63.9 /100 | #163 | Good 12.0% |
| Swiss | 63.6 /100 | #164 | Good 12.0% |
| German Russians | 61.8 /100 | #165 | Good 12.0% |
| Tohono O'odham | 60.4 /100 | #166 | Good 12.0% |
| Ethiopians | 58.5 /100 | #167 | Average 12.0% |