Guatemalan vs Bangladeshi Householder Income Ages 25 - 44 years
COMPARE
Guatemalan
Bangladeshi
Householder Income Ages 25 - 44 years
Householder Income Ages 25 - 44 years Comparison
Guatemalans
Bangladeshis
$82,331
HOUSEHOLDER INCOME AGES 25 - 44 YEARS
0.1/ 100
METRIC RATING
283rd/ 347
METRIC RANK
$81,363
HOUSEHOLDER INCOME AGES 25 - 44 YEARS
0.1/ 100
METRIC RATING
295th/ 347
METRIC RANK
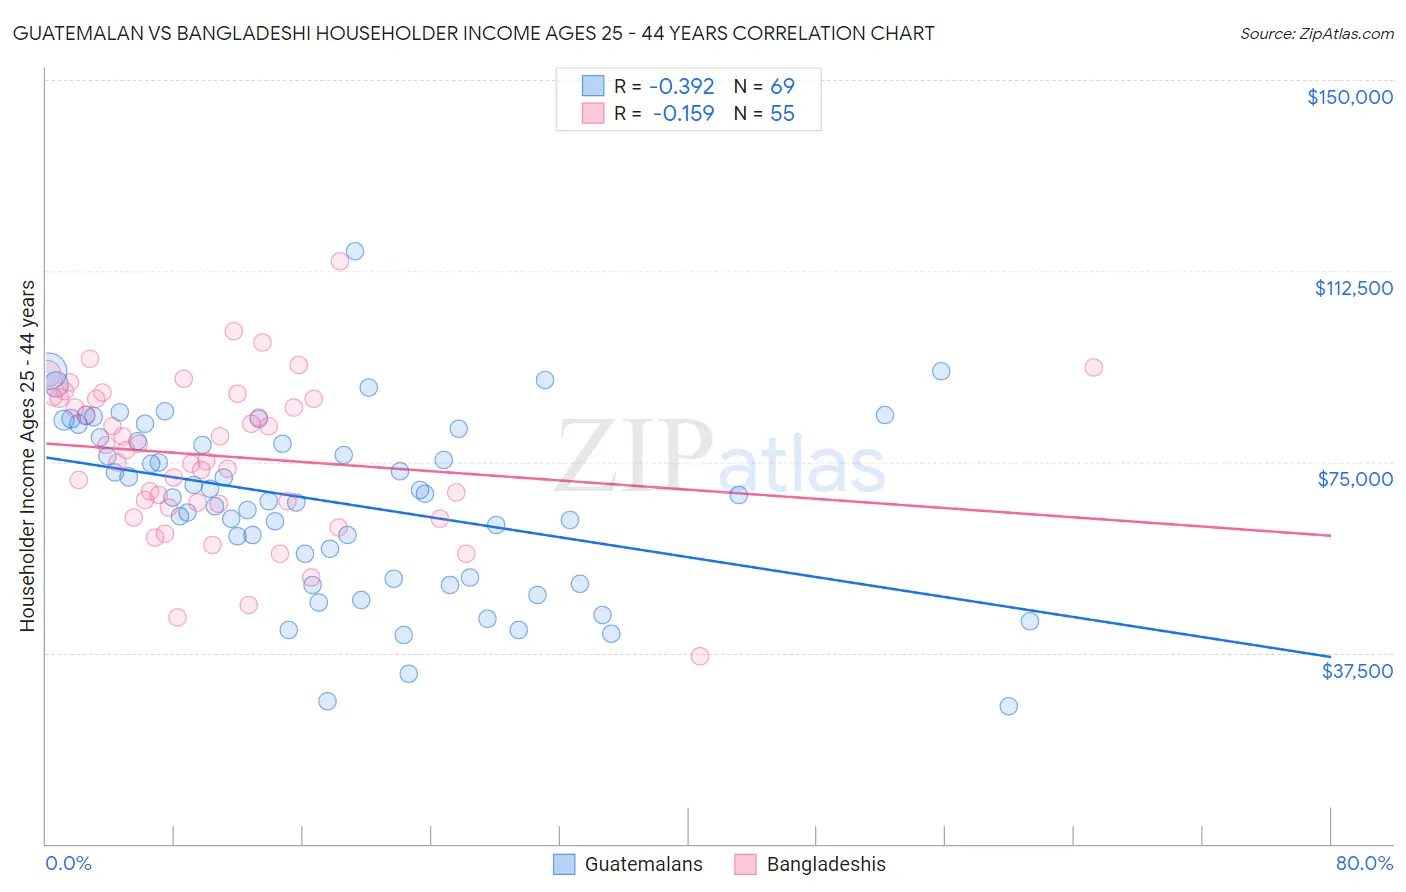
Guatemalan vs Bangladeshi Householder Income Ages 25 - 44 years Correlation Chart
The statistical analysis conducted on geographies consisting of 408,654,214 people shows a mild negative correlation between the proportion of Guatemalans and household income with householder between the ages 25 and 44 in the United States with a correlation coefficient (R) of -0.392 and weighted average of $82,331. Similarly, the statistical analysis conducted on geographies consisting of 141,274,107 people shows a poor negative correlation between the proportion of Bangladeshis and household income with householder between the ages 25 and 44 in the United States with a correlation coefficient (R) of -0.159 and weighted average of $81,363, a difference of 1.2%.
Householder Income Ages 25 - 44 years Correlation Summary
| Measurement | Guatemalan | Bangladeshi |
| Minimum | $26,896 | $36,818 |
| Maximum | $116,391 | $114,417 |
| Range | $89,495 | $77,599 |
| Mean | $66,998 | $76,117 |
| Median | $68,529 | $77,308 |
| Interquartile 25% (IQ1) | $52,170 | $66,732 |
| Interquartile 75% (IQ3) | $80,667 | $87,531 |
| Interquartile Range (IQR) | $28,496 | $20,799 |
| Standard Deviation (Sample) | $17,389 | $15,116 |
| Standard Deviation (Population) | $17,262 | $14,978 |
Demographics Similar to Guatemalans and Bangladeshis by Householder Income Ages 25 - 44 years
In terms of householder income ages 25 - 44 years, the demographic groups most similar to Guatemalans are Central American Indian ($82,355, a difference of 0.030%), Cajun ($82,393, a difference of 0.070%), Immigrants from Middle Africa ($82,254, a difference of 0.090%), Immigrants from Somalia ($82,188, a difference of 0.17%), and Ute ($82,166, a difference of 0.20%). Similarly, the demographic groups most similar to Bangladeshis are Immigrants from Dominica ($81,351, a difference of 0.020%), Immigrants from Guatemala ($81,341, a difference of 0.030%), Cuban ($81,483, a difference of 0.15%), Dominican ($81,229, a difference of 0.17%), and Blackfeet ($81,531, a difference of 0.21%).
| Demographics | Rating | Rank | Householder Income Ages 25 - 44 years |
| Pima | 0.1 /100 | #279 | Tragic $82,821 |
| Colville | 0.1 /100 | #280 | Tragic $82,604 |
| Cajuns | 0.1 /100 | #281 | Tragic $82,393 |
| Central American Indians | 0.1 /100 | #282 | Tragic $82,355 |
| Guatemalans | 0.1 /100 | #283 | Tragic $82,331 |
| Immigrants | Middle Africa | 0.1 /100 | #284 | Tragic $82,254 |
| Immigrants | Somalia | 0.1 /100 | #285 | Tragic $82,188 |
| Ute | 0.1 /100 | #286 | Tragic $82,166 |
| Immigrants | Latin America | 0.1 /100 | #287 | Tragic $82,166 |
| Comanche | 0.1 /100 | #288 | Tragic $82,152 |
| Shoshone | 0.1 /100 | #289 | Tragic $82,062 |
| Liberians | 0.1 /100 | #290 | Tragic $82,005 |
| Potawatomi | 0.1 /100 | #291 | Tragic $81,774 |
| Yaqui | 0.1 /100 | #292 | Tragic $81,656 |
| Blackfeet | 0.1 /100 | #293 | Tragic $81,531 |
| Cubans | 0.1 /100 | #294 | Tragic $81,483 |
| Bangladeshis | 0.1 /100 | #295 | Tragic $81,363 |
| Immigrants | Dominica | 0.1 /100 | #296 | Tragic $81,351 |
| Immigrants | Guatemala | 0.1 /100 | #297 | Tragic $81,341 |
| Dominicans | 0.1 /100 | #298 | Tragic $81,229 |
| Immigrants | Liberia | 0.1 /100 | #299 | Tragic $80,863 |