Guatemalan vs Laotian Householder Income Ages 25 - 44 years
COMPARE
Guatemalan
Laotian
Householder Income Ages 25 - 44 years
Householder Income Ages 25 - 44 years Comparison
Guatemalans
Laotians
$82,331
HOUSEHOLDER INCOME AGES 25 - 44 YEARS
0.1/ 100
METRIC RATING
283rd/ 347
METRIC RANK
$104,993
HOUSEHOLDER INCOME AGES 25 - 44 YEARS
99.7/ 100
METRIC RATING
66th/ 347
METRIC RANK
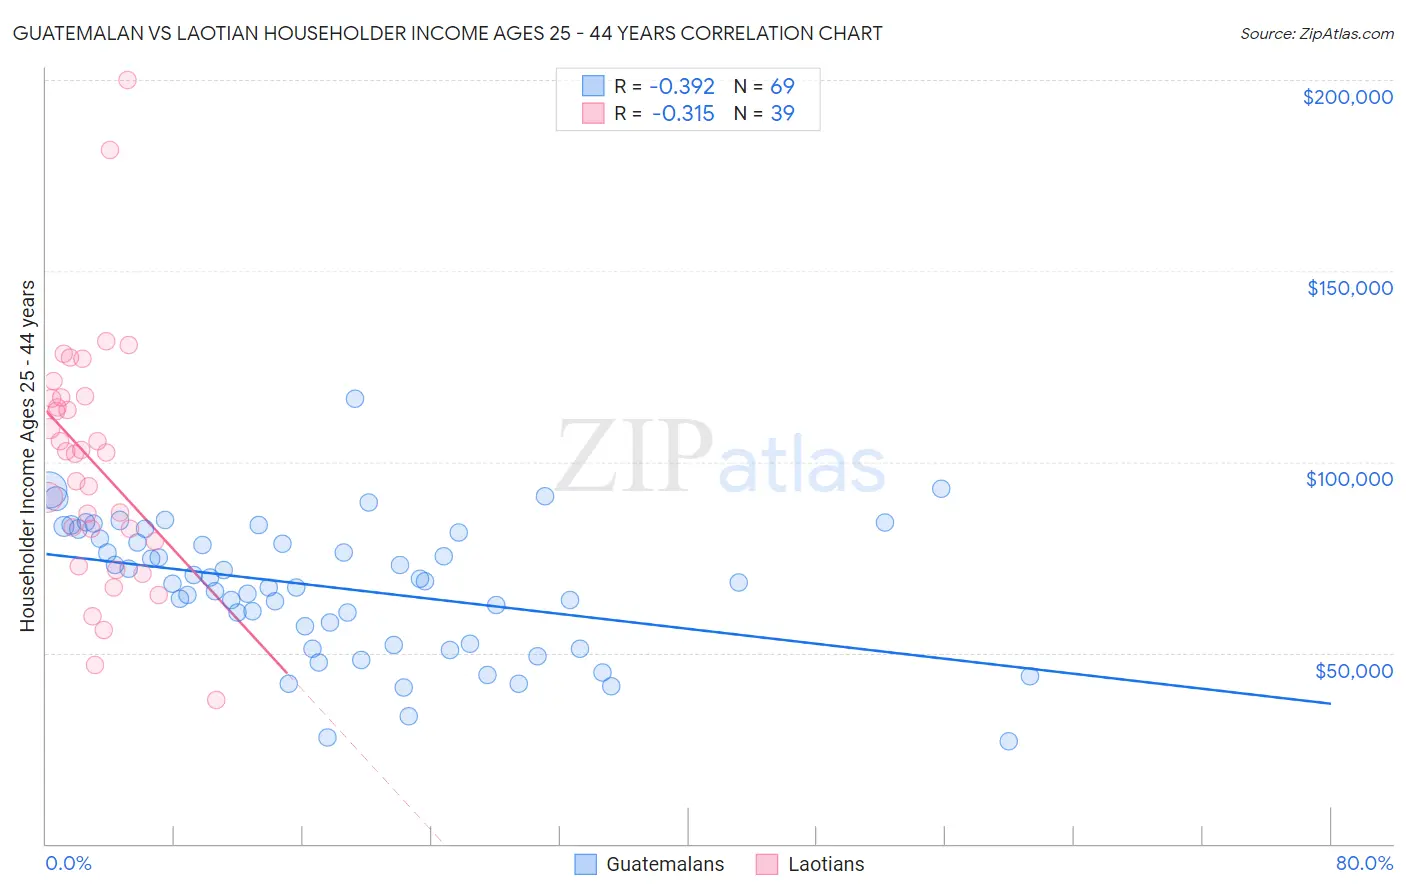
Guatemalan vs Laotian Householder Income Ages 25 - 44 years Correlation Chart
The statistical analysis conducted on geographies consisting of 408,654,214 people shows a mild negative correlation between the proportion of Guatemalans and household income with householder between the ages 25 and 44 in the United States with a correlation coefficient (R) of -0.392 and weighted average of $82,331. Similarly, the statistical analysis conducted on geographies consisting of 224,507,973 people shows a mild negative correlation between the proportion of Laotians and household income with householder between the ages 25 and 44 in the United States with a correlation coefficient (R) of -0.315 and weighted average of $104,993, a difference of 27.5%.
Householder Income Ages 25 - 44 years Correlation Summary
| Measurement | Guatemalan | Laotian |
| Minimum | $26,896 | $37,722 |
| Maximum | $116,391 | $199,931 |
| Range | $89,495 | $162,209 |
| Mean | $66,998 | $99,903 |
| Median | $68,529 | $102,522 |
| Interquartile 25% (IQ1) | $52,170 | $79,125 |
| Interquartile 75% (IQ3) | $80,667 | $116,790 |
| Interquartile Range (IQR) | $28,496 | $37,665 |
| Standard Deviation (Sample) | $17,389 | $32,336 |
| Standard Deviation (Population) | $17,262 | $31,919 |
Similar Demographics by Householder Income Ages 25 - 44 years
Demographics Similar to Guatemalans by Householder Income Ages 25 - 44 years
In terms of householder income ages 25 - 44 years, the demographic groups most similar to Guatemalans are Central American Indian ($82,355, a difference of 0.030%), Cajun ($82,393, a difference of 0.070%), Immigrants from Middle Africa ($82,254, a difference of 0.090%), Immigrants from Somalia ($82,188, a difference of 0.17%), and Ute ($82,166, a difference of 0.20%).
| Demographics | Rating | Rank | Householder Income Ages 25 - 44 years |
| Immigrants | Belize | 0.2 /100 | #276 | Tragic $83,141 |
| Paiute | 0.2 /100 | #277 | Tragic $82,984 |
| Senegalese | 0.2 /100 | #278 | Tragic $82,852 |
| Pima | 0.1 /100 | #279 | Tragic $82,821 |
| Colville | 0.1 /100 | #280 | Tragic $82,604 |
| Cajuns | 0.1 /100 | #281 | Tragic $82,393 |
| Central American Indians | 0.1 /100 | #282 | Tragic $82,355 |
| Guatemalans | 0.1 /100 | #283 | Tragic $82,331 |
| Immigrants | Middle Africa | 0.1 /100 | #284 | Tragic $82,254 |
| Immigrants | Somalia | 0.1 /100 | #285 | Tragic $82,188 |
| Ute | 0.1 /100 | #286 | Tragic $82,166 |
| Immigrants | Latin America | 0.1 /100 | #287 | Tragic $82,166 |
| Comanche | 0.1 /100 | #288 | Tragic $82,152 |
| Shoshone | 0.1 /100 | #289 | Tragic $82,062 |
| Liberians | 0.1 /100 | #290 | Tragic $82,005 |
Demographics Similar to Laotians by Householder Income Ages 25 - 44 years
In terms of householder income ages 25 - 44 years, the demographic groups most similar to Laotians are Immigrants from Netherlands ($105,082, a difference of 0.080%), Immigrants from Scotland ($105,089, a difference of 0.090%), New Zealander ($105,085, a difference of 0.090%), Immigrants from Italy ($105,201, a difference of 0.20%), and Lithuanian ($105,223, a difference of 0.22%).
| Demographics | Rating | Rank | Householder Income Ages 25 - 44 years |
| Immigrants | Latvia | 99.8 /100 | #59 | Exceptional $105,522 |
| Egyptians | 99.7 /100 | #60 | Exceptional $105,282 |
| Lithuanians | 99.7 /100 | #61 | Exceptional $105,223 |
| Immigrants | Italy | 99.7 /100 | #62 | Exceptional $105,201 |
| Immigrants | Scotland | 99.7 /100 | #63 | Exceptional $105,089 |
| New Zealanders | 99.7 /100 | #64 | Exceptional $105,085 |
| Immigrants | Netherlands | 99.7 /100 | #65 | Exceptional $105,082 |
| Laotians | 99.7 /100 | #66 | Exceptional $104,993 |
| Immigrants | Romania | 99.6 /100 | #67 | Exceptional $104,713 |
| Immigrants | Eastern Europe | 99.6 /100 | #68 | Exceptional $104,662 |
| Mongolians | 99.6 /100 | #69 | Exceptional $104,578 |
| Immigrants | Croatia | 99.6 /100 | #70 | Exceptional $104,503 |
| Afghans | 99.6 /100 | #71 | Exceptional $104,410 |
| Chinese | 99.5 /100 | #72 | Exceptional $104,264 |
| Italians | 99.5 /100 | #73 | Exceptional $104,215 |