Bahamian vs Immigrants from Jamaica Median Family Income
COMPARE
Bahamian
Immigrants from Jamaica
Median Family Income
Median Family Income Comparison
Bahamians
Immigrants from Jamaica
$82,631
MEDIAN FAMILY INCOME
0.0/ 100
METRIC RATING
323rd/ 347
METRIC RANK
$89,268
MEDIAN FAMILY INCOME
0.1/ 100
METRIC RATING
277th/ 347
METRIC RANK
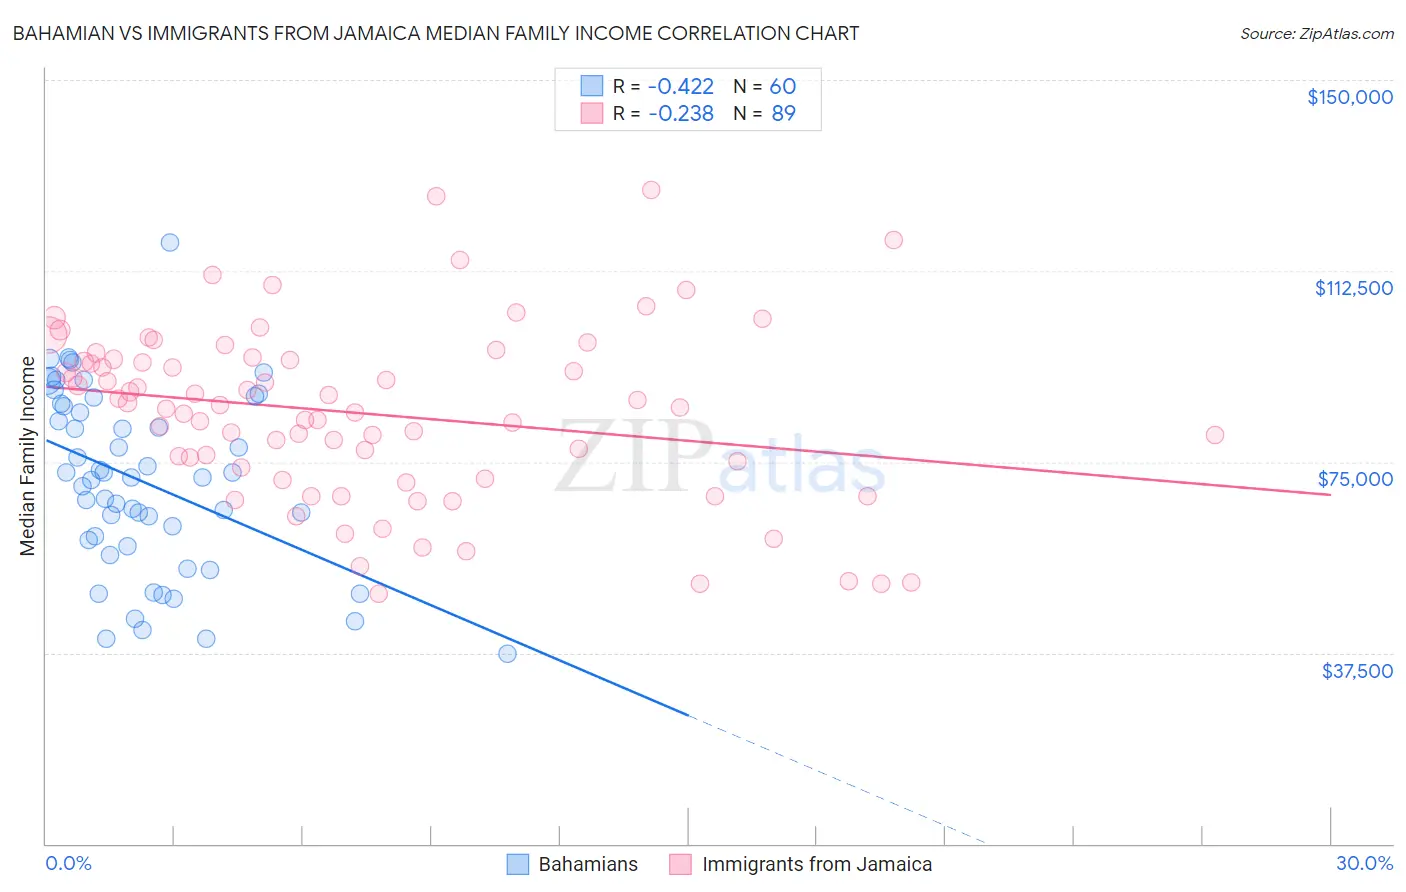
Bahamian vs Immigrants from Jamaica Median Family Income Correlation Chart
The statistical analysis conducted on geographies consisting of 112,596,489 people shows a moderate negative correlation between the proportion of Bahamians and median family income in the United States with a correlation coefficient (R) of -0.422 and weighted average of $82,631. Similarly, the statistical analysis conducted on geographies consisting of 301,510,584 people shows a weak negative correlation between the proportion of Immigrants from Jamaica and median family income in the United States with a correlation coefficient (R) of -0.238 and weighted average of $89,268, a difference of 8.0%.
Median Family Income Correlation Summary
| Measurement | Bahamian | Immigrants from Jamaica |
| Minimum | $37,231 | $49,200 |
| Maximum | $118,067 | $128,421 |
| Range | $80,836 | $79,221 |
| Mean | $71,118 | $84,512 |
| Median | $71,812 | $85,741 |
| Interquartile 25% (IQ1) | $59,044 | $72,845 |
| Interquartile 75% (IQ3) | $86,176 | $95,144 |
| Interquartile Range (IQR) | $27,132 | $22,299 |
| Standard Deviation (Sample) | $17,647 | $17,087 |
| Standard Deviation (Population) | $17,499 | $16,991 |
Similar Demographics by Median Family Income
Demographics Similar to Bahamians by Median Family Income
In terms of median family income, the demographic groups most similar to Bahamians are Creek ($82,560, a difference of 0.090%), Sioux ($82,386, a difference of 0.30%), Dominican ($82,888, a difference of 0.31%), Immigrants from Congo ($82,216, a difference of 0.51%), and Arapaho ($82,064, a difference of 0.69%).
| Demographics | Rating | Rank | Median Family Income |
| Immigrants | Haiti | 0.0 /100 | #316 | Tragic $84,018 |
| Yakama | 0.0 /100 | #317 | Tragic $83,932 |
| Immigrants | Mexico | 0.0 /100 | #318 | Tragic $83,639 |
| Immigrants | Honduras | 0.0 /100 | #319 | Tragic $83,618 |
| Seminole | 0.0 /100 | #320 | Tragic $83,354 |
| Immigrants | Caribbean | 0.0 /100 | #321 | Tragic $83,319 |
| Dominicans | 0.0 /100 | #322 | Tragic $82,888 |
| Bahamians | 0.0 /100 | #323 | Tragic $82,631 |
| Creek | 0.0 /100 | #324 | Tragic $82,560 |
| Sioux | 0.0 /100 | #325 | Tragic $82,386 |
| Immigrants | Congo | 0.0 /100 | #326 | Tragic $82,216 |
| Arapaho | 0.0 /100 | #327 | Tragic $82,064 |
| Blacks/African Americans | 0.0 /100 | #328 | Tragic $81,912 |
| Dutch West Indians | 0.0 /100 | #329 | Tragic $81,852 |
| Cheyenne | 0.0 /100 | #330 | Tragic $81,385 |
Demographics Similar to Immigrants from Jamaica by Median Family Income
In terms of median family income, the demographic groups most similar to Immigrants from Jamaica are Immigrants from Zaire ($89,285, a difference of 0.020%), Immigrants from Grenada ($89,249, a difference of 0.020%), Immigrants from Belize ($89,197, a difference of 0.080%), British West Indian ($88,987, a difference of 0.32%), and Blackfeet ($88,717, a difference of 0.62%).
| Demographics | Rating | Rank | Median Family Income |
| Jamaicans | 0.2 /100 | #270 | Tragic $90,581 |
| Iroquois | 0.2 /100 | #271 | Tragic $90,543 |
| Immigrants | Liberia | 0.2 /100 | #272 | Tragic $90,450 |
| Immigrants | Micronesia | 0.2 /100 | #273 | Tragic $90,345 |
| Spanish Americans | 0.2 /100 | #274 | Tragic $90,322 |
| Immigrants | St. Vincent and the Grenadines | 0.2 /100 | #275 | Tragic $90,094 |
| Immigrants | Zaire | 0.1 /100 | #276 | Tragic $89,285 |
| Immigrants | Jamaica | 0.1 /100 | #277 | Tragic $89,268 |
| Immigrants | Grenada | 0.1 /100 | #278 | Tragic $89,249 |
| Immigrants | Belize | 0.1 /100 | #279 | Tragic $89,197 |
| British West Indians | 0.1 /100 | #280 | Tragic $88,987 |
| Blackfeet | 0.1 /100 | #281 | Tragic $88,717 |
| Comanche | 0.1 /100 | #282 | Tragic $88,556 |
| Bangladeshis | 0.1 /100 | #283 | Tragic $88,358 |
| Indonesians | 0.1 /100 | #284 | Tragic $88,301 |