Ghanaian vs Black/African American Professional Degree
COMPARE
Ghanaian
Black/African American
Professional Degree
Professional Degree Comparison
Ghanaians
Blacks/African Americans
4.3%
PROFESSIONAL DEGREE
27.3/ 100
METRIC RATING
192nd/ 347
METRIC RANK
3.4%
PROFESSIONAL DEGREE
0.2/ 100
METRIC RATING
300th/ 347
METRIC RANK
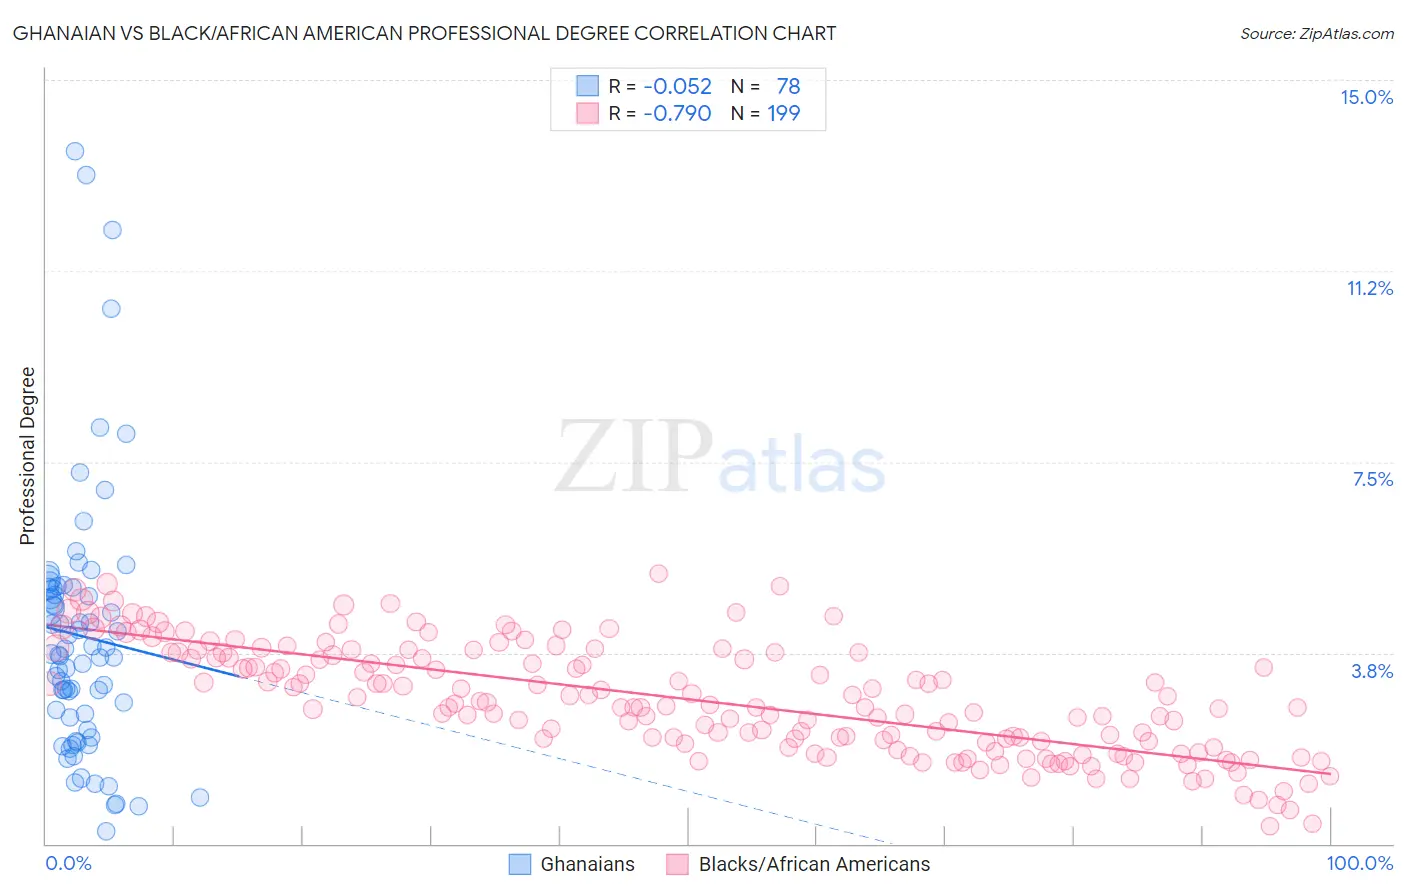
Ghanaian vs Black/African American Professional Degree Correlation Chart
The statistical analysis conducted on geographies consisting of 190,481,529 people shows a slight negative correlation between the proportion of Ghanaians and percentage of population with at least professional degree education in the United States with a correlation coefficient (R) of -0.052 and weighted average of 4.3%. Similarly, the statistical analysis conducted on geographies consisting of 557,362,450 people shows a strong negative correlation between the proportion of Blacks/African Americans and percentage of population with at least professional degree education in the United States with a correlation coefficient (R) of -0.790 and weighted average of 3.4%, a difference of 24.9%.
Professional Degree Correlation Summary
| Measurement | Ghanaian | Black/African American |
| Minimum | 0.25% | 0.36% |
| Maximum | 13.6% | 5.3% |
| Range | 13.4% | 4.9% |
| Mean | 4.1% | 2.8% |
| Median | 3.7% | 2.7% |
| Interquartile 25% (IQ1) | 2.5% | 2.0% |
| Interquartile 75% (IQ3) | 5.0% | 3.8% |
| Interquartile Range (IQR) | 2.5% | 1.8% |
| Standard Deviation (Sample) | 2.6% | 1.1% |
| Standard Deviation (Population) | 2.6% | 1.1% |
Similar Demographics by Professional Degree
Demographics Similar to Ghanaians by Professional Degree
In terms of professional degree, the demographic groups most similar to Ghanaians are French (4.2%, a difference of 0.040%), Scandinavian (4.2%, a difference of 0.29%), Sri Lankan (4.3%, a difference of 0.32%), Immigrants from Poland (4.3%, a difference of 0.36%), and Nigerian (4.2%, a difference of 0.53%).
| Demographics | Rating | Rank | Professional Degree |
| Welsh | 35.8 /100 | #185 | Fair 4.3% |
| Scotch-Irish | 34.2 /100 | #186 | Fair 4.3% |
| Immigrants | Cameroon | 33.3 /100 | #187 | Fair 4.3% |
| Immigrants | Thailand | 31.7 /100 | #188 | Fair 4.3% |
| Slovaks | 30.7 /100 | #189 | Fair 4.3% |
| Immigrants | Poland | 29.2 /100 | #190 | Fair 4.3% |
| Sri Lankans | 29.0 /100 | #191 | Fair 4.3% |
| Ghanaians | 27.3 /100 | #192 | Fair 4.3% |
| French | 27.1 /100 | #193 | Fair 4.2% |
| Scandinavians | 25.8 /100 | #194 | Fair 4.2% |
| Nigerians | 24.6 /100 | #195 | Fair 4.2% |
| Spanish | 23.0 /100 | #196 | Fair 4.2% |
| Czechoslovakians | 22.4 /100 | #197 | Fair 4.2% |
| Immigrants | Middle Africa | 22.1 /100 | #198 | Fair 4.2% |
| Norwegians | 20.5 /100 | #199 | Fair 4.2% |
Demographics Similar to Blacks/African Americans by Professional Degree
In terms of professional degree, the demographic groups most similar to Blacks/African Americans are Immigrants from Yemen (3.4%, a difference of 0.13%), Immigrants from Dominican Republic (3.4%, a difference of 0.14%), Malaysian (3.4%, a difference of 0.25%), Ottawa (3.4%, a difference of 0.80%), and Immigrants from Liberia (3.4%, a difference of 0.85%).
| Demographics | Rating | Rank | Professional Degree |
| Immigrants | Honduras | 0.3 /100 | #293 | Tragic 3.5% |
| Paiute | 0.3 /100 | #294 | Tragic 3.4% |
| Immigrants | Guatemala | 0.2 /100 | #295 | Tragic 3.4% |
| Hawaiians | 0.2 /100 | #296 | Tragic 3.4% |
| Immigrants | Liberia | 0.2 /100 | #297 | Tragic 3.4% |
| Ottawa | 0.2 /100 | #298 | Tragic 3.4% |
| Immigrants | Yemen | 0.2 /100 | #299 | Tragic 3.4% |
| Blacks/African Americans | 0.2 /100 | #300 | Tragic 3.4% |
| Immigrants | Dominican Republic | 0.2 /100 | #301 | Tragic 3.4% |
| Malaysians | 0.2 /100 | #302 | Tragic 3.4% |
| Immigrants | Haiti | 0.2 /100 | #303 | Tragic 3.4% |
| Cajuns | 0.2 /100 | #304 | Tragic 3.4% |
| Chickasaw | 0.1 /100 | #305 | Tragic 3.4% |
| Cape Verdeans | 0.1 /100 | #306 | Tragic 3.4% |
| Samoans | 0.1 /100 | #307 | Tragic 3.3% |