German Russian vs Immigrants from Liberia Median Female Earnings
COMPARE
German Russian
Immigrants from Liberia
Median Female Earnings
Median Female Earnings Comparison
German Russians
Immigrants from Liberia
$37,105
MEDIAN FEMALE EARNINGS
0.5/ 100
METRIC RATING
263rd/ 347
METRIC RANK
$37,970
MEDIAN FEMALE EARNINGS
2.7/ 100
METRIC RATING
244th/ 347
METRIC RANK
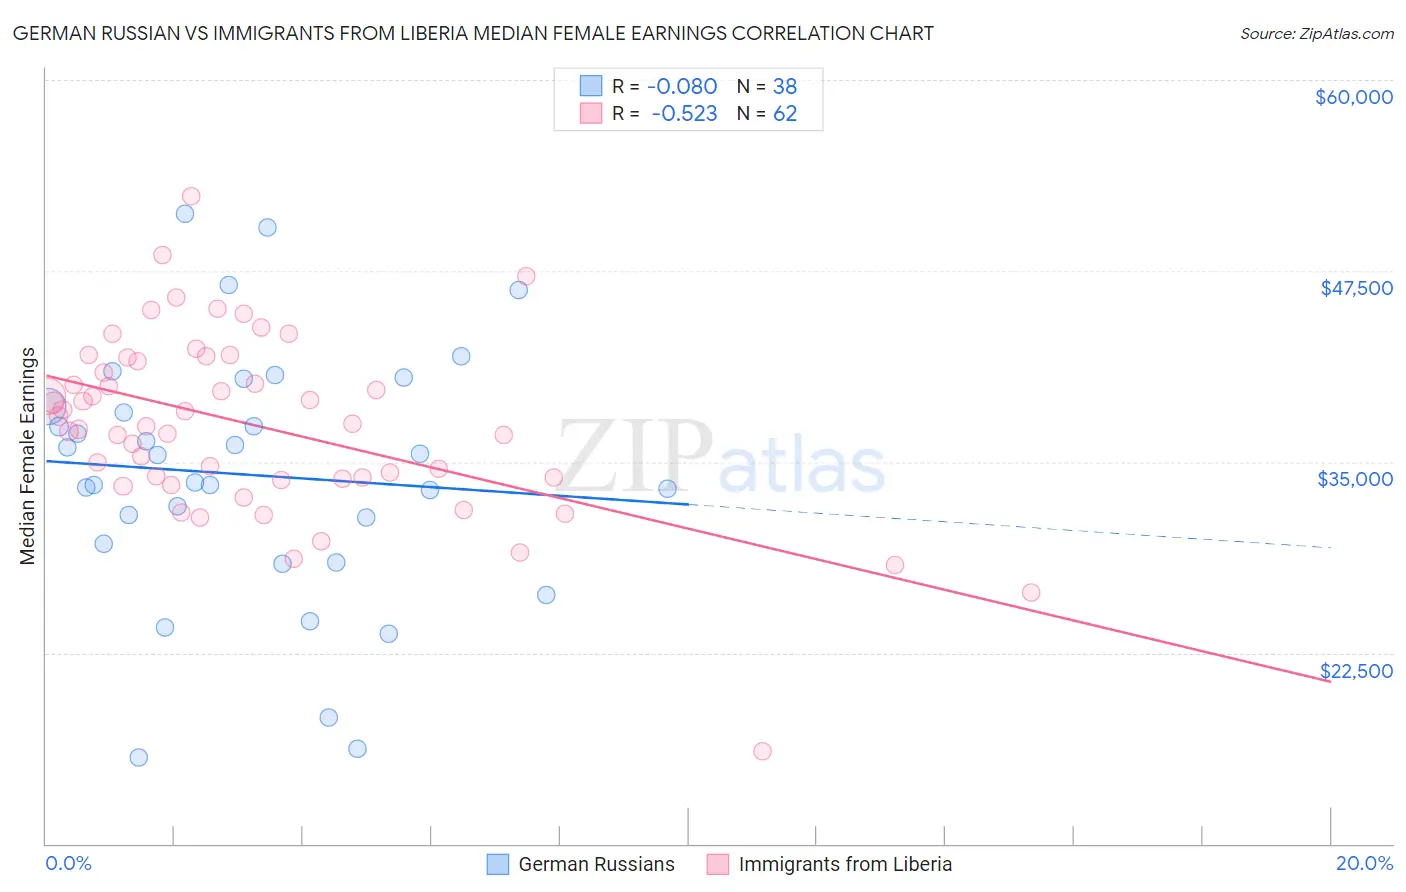
German Russian vs Immigrants from Liberia Median Female Earnings Correlation Chart
The statistical analysis conducted on geographies consisting of 96,453,013 people shows a slight negative correlation between the proportion of German Russians and median female earnings in the United States with a correlation coefficient (R) of -0.080 and weighted average of $37,105. Similarly, the statistical analysis conducted on geographies consisting of 135,268,038 people shows a substantial negative correlation between the proportion of Immigrants from Liberia and median female earnings in the United States with a correlation coefficient (R) of -0.523 and weighted average of $37,970, a difference of 2.3%.
Median Female Earnings Correlation Summary
| Measurement | German Russian | Immigrants from Liberia |
| Minimum | $15,652 | $16,076 |
| Maximum | $51,256 | $52,381 |
| Range | $35,604 | $36,305 |
| Mean | $34,138 | $37,357 |
| Median | $34,536 | $37,425 |
| Interquartile 25% (IQ1) | $29,635 | $33,898 |
| Interquartile 75% (IQ3) | $38,614 | $41,557 |
| Interquartile Range (IQR) | $8,979 | $7,659 |
| Standard Deviation (Sample) | $8,300 | $5,953 |
| Standard Deviation (Population) | $8,190 | $5,904 |
Demographics Similar to German Russians and Immigrants from Liberia by Median Female Earnings
In terms of median female earnings, the demographic groups most similar to German Russians are Venezuelan ($37,282, a difference of 0.48%), Malaysian ($37,298, a difference of 0.52%), Dutch ($37,339, a difference of 0.63%), Scotch-Irish ($37,383, a difference of 0.75%), and Belizean ($37,429, a difference of 0.87%). Similarly, the demographic groups most similar to Immigrants from Liberia are Immigrants from Middle Africa ($37,965, a difference of 0.010%), Delaware ($37,964, a difference of 0.010%), German ($37,986, a difference of 0.040%), Immigrants from Somalia ($37,914, a difference of 0.15%), and Alaskan Athabascan ($37,905, a difference of 0.17%).
| Demographics | Rating | Rank | Median Female Earnings |
| Germans | 2.8 /100 | #243 | Tragic $37,986 |
| Immigrants | Liberia | 2.7 /100 | #244 | Tragic $37,970 |
| Immigrants | Middle Africa | 2.7 /100 | #245 | Tragic $37,965 |
| Delaware | 2.6 /100 | #246 | Tragic $37,964 |
| Immigrants | Somalia | 2.4 /100 | #247 | Tragic $37,914 |
| Alaskan Athabascans | 2.3 /100 | #248 | Tragic $37,905 |
| Swiss | 2.3 /100 | #249 | Tragic $37,904 |
| Immigrants | Iraq | 2.2 /100 | #250 | Tragic $37,864 |
| Welsh | 2.1 /100 | #251 | Tragic $37,856 |
| Immigrants | Dominica | 2.0 /100 | #252 | Tragic $37,825 |
| Danes | 1.6 /100 | #253 | Tragic $37,730 |
| Whites/Caucasians | 1.1 /100 | #254 | Tragic $37,531 |
| Colville | 1.1 /100 | #255 | Tragic $37,514 |
| Samoans | 1.0 /100 | #256 | Tragic $37,498 |
| Hawaiians | 1.0 /100 | #257 | Tragic $37,497 |
| Belizeans | 0.9 /100 | #258 | Tragic $37,429 |
| Scotch-Irish | 0.8 /100 | #259 | Tragic $37,383 |
| Dutch | 0.7 /100 | #260 | Tragic $37,339 |
| Malaysians | 0.7 /100 | #261 | Tragic $37,298 |
| Venezuelans | 0.7 /100 | #262 | Tragic $37,282 |
| German Russians | 0.5 /100 | #263 | Tragic $37,105 |