Iroquois vs Asian Householder Income Ages 45 - 64 years
COMPARE
Iroquois
Asian
Householder Income Ages 45 - 64 years
Householder Income Ages 45 - 64 years Comparison
Iroquois
Asians
$87,255
HOUSEHOLDER INCOME AGES 45 - 64 YEARS
0.1/ 100
METRIC RATING
274th/ 347
METRIC RANK
$118,426
HOUSEHOLDER INCOME AGES 45 - 64 YEARS
100.0/ 100
METRIC RATING
25th/ 347
METRIC RANK
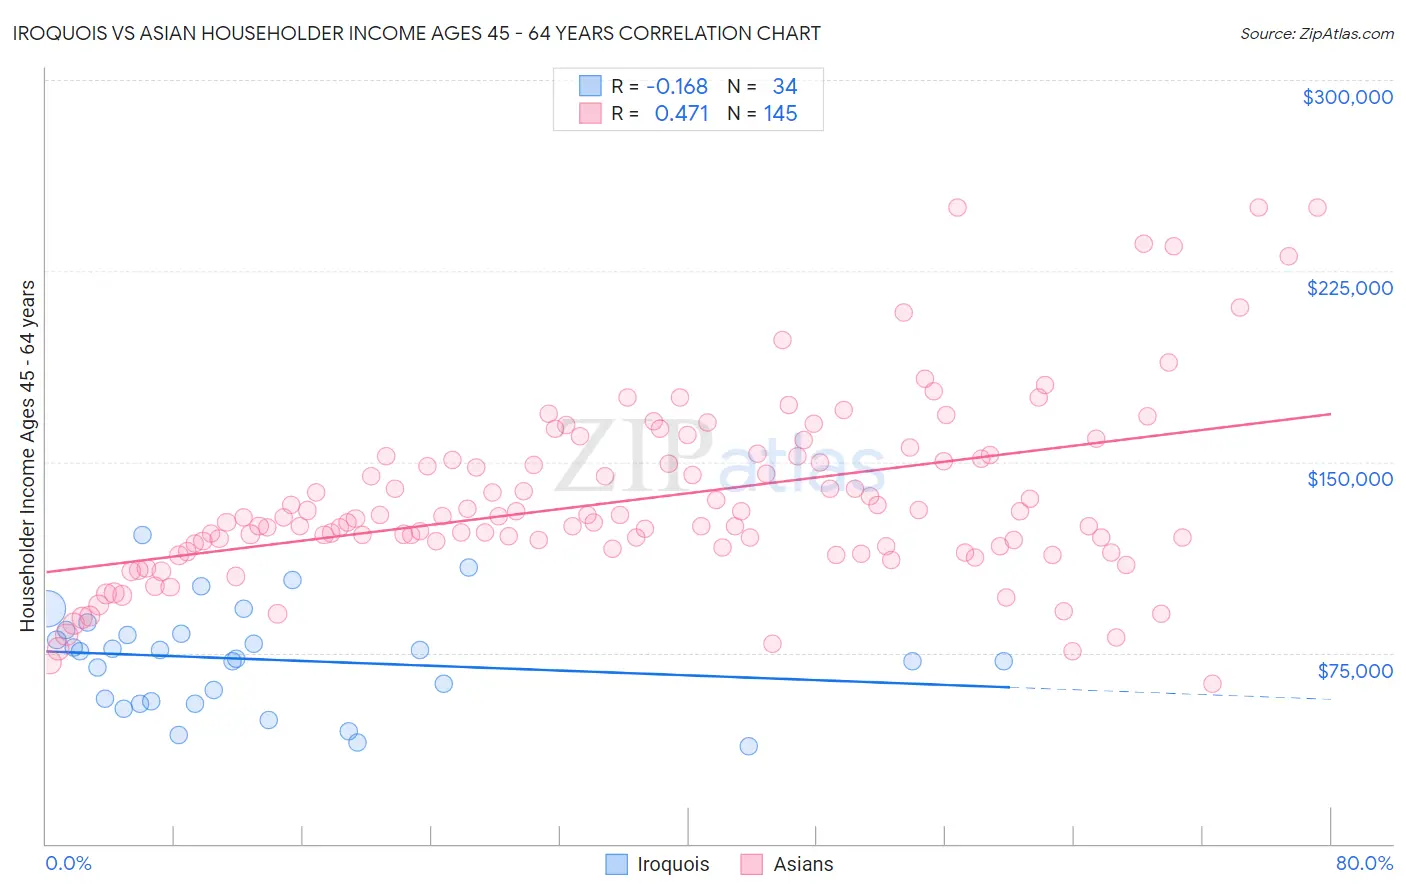
Iroquois vs Asian Householder Income Ages 45 - 64 years Correlation Chart
The statistical analysis conducted on geographies consisting of 207,070,070 people shows a poor negative correlation between the proportion of Iroquois and household income with householder between the ages 45 and 64 in the United States with a correlation coefficient (R) of -0.168 and weighted average of $87,255. Similarly, the statistical analysis conducted on geographies consisting of 548,262,581 people shows a moderate positive correlation between the proportion of Asians and household income with householder between the ages 45 and 64 in the United States with a correlation coefficient (R) of 0.471 and weighted average of $118,426, a difference of 35.7%.
Householder Income Ages 45 - 64 years Correlation Summary
| Measurement | Iroquois | Asian |
| Minimum | $38,056 | $62,982 |
| Maximum | $121,151 | $250,001 |
| Range | $83,095 | $187,019 |
| Mean | $72,442 | $135,000 |
| Median | $74,085 | $127,763 |
| Interquartile 25% (IQ1) | $55,882 | $116,265 |
| Interquartile 75% (IQ3) | $82,434 | $151,736 |
| Interquartile Range (IQR) | $26,552 | $35,471 |
| Standard Deviation (Sample) | $20,014 | $35,213 |
| Standard Deviation (Population) | $19,717 | $35,092 |
Similar Demographics by Householder Income Ages 45 - 64 years
Demographics Similar to Iroquois by Householder Income Ages 45 - 64 years
In terms of householder income ages 45 - 64 years, the demographic groups most similar to Iroquois are Immigrants from Belize ($87,229, a difference of 0.030%), Immigrants from Latin America ($87,219, a difference of 0.040%), Cree ($87,185, a difference of 0.080%), Immigrants from Jamaica ($87,035, a difference of 0.25%), and Yakama ($86,992, a difference of 0.30%).
| Demographics | Rating | Rank | Householder Income Ages 45 - 64 years |
| Hmong | 0.2 /100 | #267 | Tragic $88,115 |
| Immigrants | Micronesia | 0.2 /100 | #268 | Tragic $87,864 |
| Spanish Americans | 0.2 /100 | #269 | Tragic $87,836 |
| Immigrants | Liberia | 0.2 /100 | #270 | Tragic $87,739 |
| Guatemalans | 0.2 /100 | #271 | Tragic $87,705 |
| Cape Verdeans | 0.2 /100 | #272 | Tragic $87,580 |
| Spanish American Indians | 0.2 /100 | #273 | Tragic $87,561 |
| Iroquois | 0.1 /100 | #274 | Tragic $87,255 |
| Immigrants | Belize | 0.1 /100 | #275 | Tragic $87,229 |
| Immigrants | Latin America | 0.1 /100 | #276 | Tragic $87,219 |
| Cree | 0.1 /100 | #277 | Tragic $87,185 |
| Immigrants | Jamaica | 0.1 /100 | #278 | Tragic $87,035 |
| Yakama | 0.1 /100 | #279 | Tragic $86,992 |
| Immigrants | Somalia | 0.1 /100 | #280 | Tragic $86,987 |
| Yaqui | 0.1 /100 | #281 | Tragic $86,914 |
Demographics Similar to Asians by Householder Income Ages 45 - 64 years
In terms of householder income ages 45 - 64 years, the demographic groups most similar to Asians are Immigrants from Japan ($118,498, a difference of 0.060%), Immigrants from Sweden ($118,318, a difference of 0.090%), Bolivian ($118,871, a difference of 0.38%), Immigrants from Northern Europe ($117,930, a difference of 0.42%), and Immigrants from Belgium ($118,932, a difference of 0.43%).
| Demographics | Rating | Rank | Householder Income Ages 45 - 64 years |
| Immigrants | Korea | 100.0 /100 | #18 | Exceptional $121,243 |
| Eastern Europeans | 100.0 /100 | #19 | Exceptional $120,684 |
| Immigrants | Australia | 100.0 /100 | #20 | Exceptional $119,308 |
| Immigrants | Sri Lanka | 100.0 /100 | #21 | Exceptional $119,094 |
| Immigrants | Belgium | 100.0 /100 | #22 | Exceptional $118,932 |
| Bolivians | 100.0 /100 | #23 | Exceptional $118,871 |
| Immigrants | Japan | 100.0 /100 | #24 | Exceptional $118,498 |
| Asians | 100.0 /100 | #25 | Exceptional $118,426 |
| Immigrants | Sweden | 100.0 /100 | #26 | Exceptional $118,318 |
| Immigrants | Northern Europe | 100.0 /100 | #27 | Exceptional $117,930 |
| Turks | 100.0 /100 | #28 | Exceptional $117,814 |
| Bhutanese | 100.0 /100 | #29 | Exceptional $117,750 |
| Immigrants | Bolivia | 100.0 /100 | #30 | Exceptional $117,731 |
| Immigrants | Asia | 100.0 /100 | #31 | Exceptional $116,566 |
| Russians | 100.0 /100 | #32 | Exceptional $116,328 |