French Canadian vs Immigrants from Europe Median Family Income
COMPARE
French Canadian
Immigrants from Europe
Median Family Income
Median Family Income Comparison
French Canadians
Immigrants from Europe
$101,634
MEDIAN FAMILY INCOME
37.0/ 100
METRIC RATING
180th/ 347
METRIC RANK
$115,523
MEDIAN FAMILY INCOME
99.9/ 100
METRIC RATING
54th/ 347
METRIC RANK
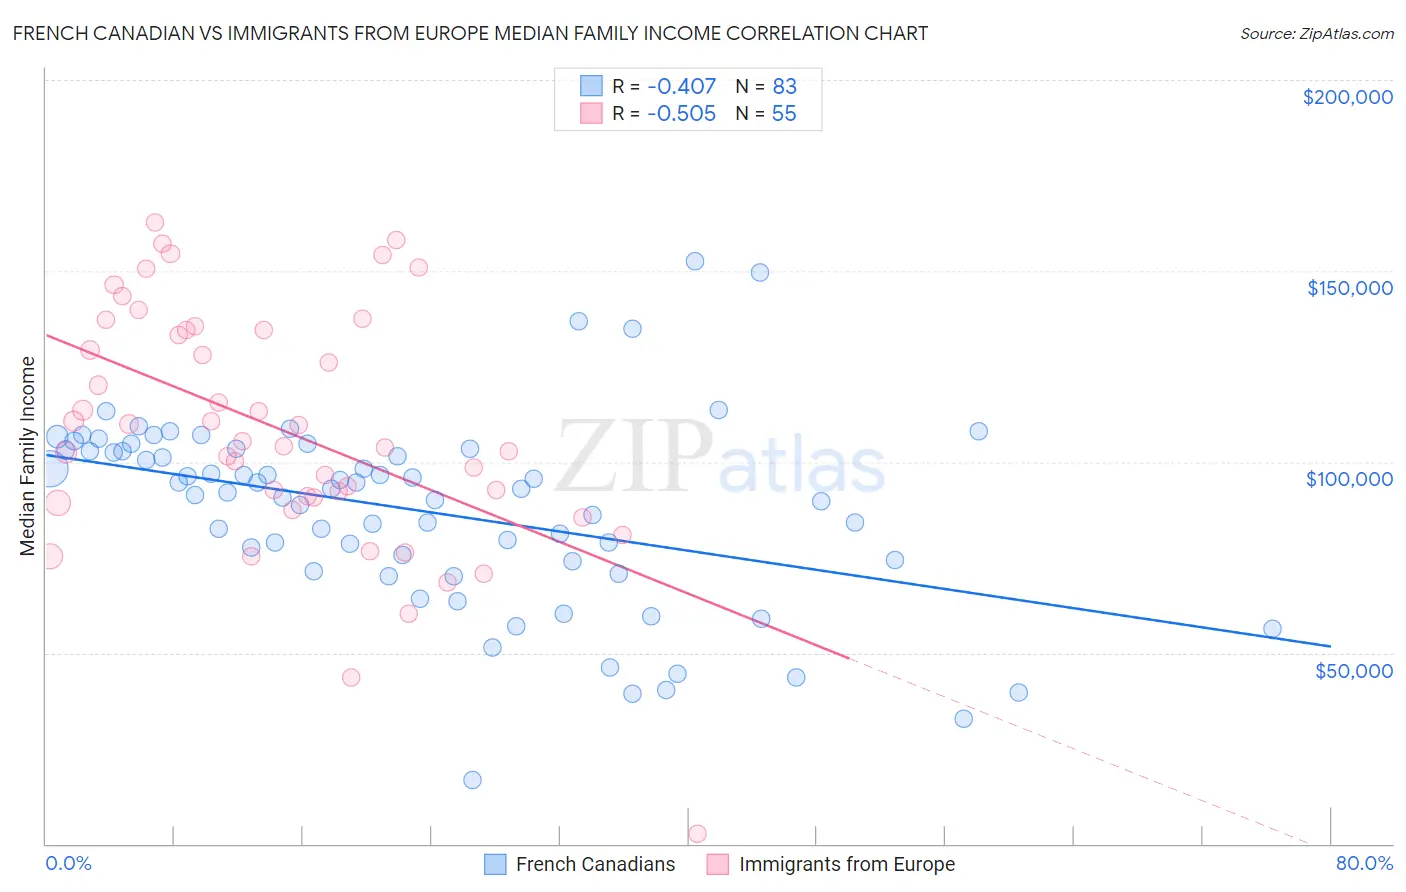
French Canadian vs Immigrants from Europe Median Family Income Correlation Chart
The statistical analysis conducted on geographies consisting of 501,962,577 people shows a moderate negative correlation between the proportion of French Canadians and median family income in the United States with a correlation coefficient (R) of -0.407 and weighted average of $101,634. Similarly, the statistical analysis conducted on geographies consisting of 546,465,722 people shows a substantial negative correlation between the proportion of Immigrants from Europe and median family income in the United States with a correlation coefficient (R) of -0.505 and weighted average of $115,523, a difference of 13.7%.
Median Family Income Correlation Summary
| Measurement | French Canadian | Immigrants from Europe |
| Minimum | $16,696 | $2,499 |
| Maximum | $152,574 | $162,783 |
| Range | $135,878 | $160,284 |
| Mean | $87,243 | $108,657 |
| Median | $92,910 | $105,246 |
| Interquartile 25% (IQ1) | $74,042 | $90,625 |
| Interquartile 75% (IQ3) | $103,222 | $134,559 |
| Interquartile Range (IQR) | $29,180 | $43,934 |
| Standard Deviation (Sample) | $24,938 | $31,673 |
| Standard Deviation (Population) | $24,788 | $31,384 |
Similar Demographics by Median Family Income
Demographics Similar to French Canadians by Median Family Income
In terms of median family income, the demographic groups most similar to French Canadians are Spaniard ($101,617, a difference of 0.020%), Tsimshian ($101,543, a difference of 0.090%), Kenyan ($101,417, a difference of 0.21%), South American ($101,856, a difference of 0.22%), and Immigrants from Costa Rica ($101,354, a difference of 0.28%).
| Demographics | Rating | Rank | Median Family Income |
| Belgians | 51.4 /100 | #173 | Average $102,788 |
| Finns | 50.0 /100 | #174 | Average $102,676 |
| Immigrants | Eastern Africa | 47.1 /100 | #175 | Average $102,451 |
| French | 46.1 /100 | #176 | Average $102,368 |
| Germans | 44.6 /100 | #177 | Average $102,254 |
| Welsh | 43.3 /100 | #178 | Average $102,151 |
| South Americans | 39.7 /100 | #179 | Fair $101,856 |
| French Canadians | 37.0 /100 | #180 | Fair $101,634 |
| Spaniards | 36.8 /100 | #181 | Fair $101,617 |
| Tsimshian | 35.9 /100 | #182 | Fair $101,543 |
| Kenyans | 34.5 /100 | #183 | Fair $101,417 |
| Immigrants | Costa Rica | 33.7 /100 | #184 | Fair $101,354 |
| Dutch | 31.9 /100 | #185 | Fair $101,192 |
| Celtics | 31.3 /100 | #186 | Fair $101,139 |
| Tlingit-Haida | 30.8 /100 | #187 | Fair $101,092 |
Demographics Similar to Immigrants from Europe by Median Family Income
In terms of median family income, the demographic groups most similar to Immigrants from Europe are Lithuanian ($115,395, a difference of 0.11%), New Zealander ($115,230, a difference of 0.25%), Immigrants from Norway ($115,847, a difference of 0.28%), Maltese ($115,862, a difference of 0.29%), and Greek ($115,192, a difference of 0.29%).
| Demographics | Rating | Rank | Median Family Income |
| Immigrants | Austria | 99.9 /100 | #47 | Exceptional $116,830 |
| Immigrants | South Africa | 99.9 /100 | #48 | Exceptional $116,286 |
| Chinese | 99.9 /100 | #49 | Exceptional $116,188 |
| Immigrants | Czechoslovakia | 99.9 /100 | #50 | Exceptional $116,165 |
| Immigrants | Malaysia | 99.9 /100 | #51 | Exceptional $115,880 |
| Maltese | 99.9 /100 | #52 | Exceptional $115,862 |
| Immigrants | Norway | 99.9 /100 | #53 | Exceptional $115,847 |
| Immigrants | Europe | 99.9 /100 | #54 | Exceptional $115,523 |
| Lithuanians | 99.8 /100 | #55 | Exceptional $115,395 |
| New Zealanders | 99.8 /100 | #56 | Exceptional $115,230 |
| Greeks | 99.8 /100 | #57 | Exceptional $115,192 |
| Immigrants | Indonesia | 99.8 /100 | #58 | Exceptional $115,162 |
| Immigrants | Netherlands | 99.8 /100 | #59 | Exceptional $114,987 |
| Immigrants | Latvia | 99.8 /100 | #60 | Exceptional $114,826 |
| Immigrants | Belarus | 99.8 /100 | #61 | Exceptional $114,586 |