Puerto Rican vs Immigrants from Austria Householder Income Ages 45 - 64 years
COMPARE
Puerto Rican
Immigrants from Austria
Householder Income Ages 45 - 64 years
Householder Income Ages 45 - 64 years Comparison
Puerto Ricans
Immigrants from Austria
$69,234
HOUSEHOLDER INCOME AGES 45 - 64 YEARS
0.0/ 100
METRIC RATING
346th/ 347
METRIC RANK
$113,140
HOUSEHOLDER INCOME AGES 45 - 64 YEARS
99.8/ 100
METRIC RATING
50th/ 347
METRIC RANK
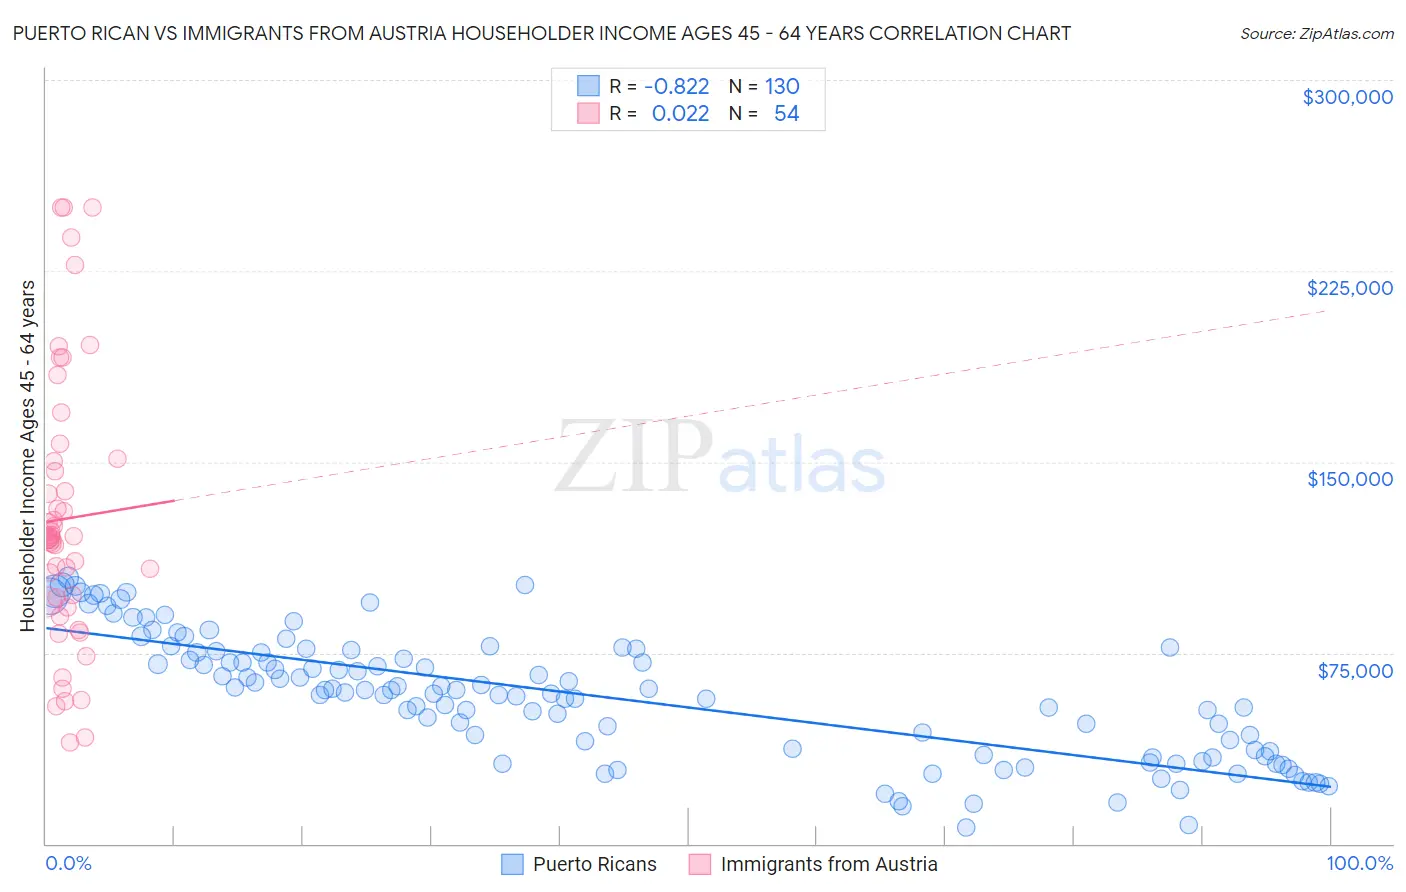
Puerto Rican vs Immigrants from Austria Householder Income Ages 45 - 64 years Correlation Chart
The statistical analysis conducted on geographies consisting of 526,175,846 people shows a very strong negative correlation between the proportion of Puerto Ricans and household income with householder between the ages 45 and 64 in the United States with a correlation coefficient (R) of -0.822 and weighted average of $69,234. Similarly, the statistical analysis conducted on geographies consisting of 167,924,064 people shows no correlation between the proportion of Immigrants from Austria and household income with householder between the ages 45 and 64 in the United States with a correlation coefficient (R) of 0.022 and weighted average of $113,140, a difference of 63.4%.
Householder Income Ages 45 - 64 years Correlation Summary
| Measurement | Puerto Rican | Immigrants from Austria |
| Minimum | $6,600 | $39,554 |
| Maximum | $104,645 | $250,001 |
| Range | $98,045 | $210,447 |
| Mean | $58,161 | $127,653 |
| Median | $60,296 | $120,029 |
| Interquartile 25% (IQ1) | $36,266 | $95,004 |
| Interquartile 75% (IQ3) | $75,781 | $150,192 |
| Interquartile Range (IQR) | $39,515 | $55,187 |
| Standard Deviation (Sample) | $24,341 | $52,842 |
| Standard Deviation (Population) | $24,247 | $52,351 |
Similar Demographics by Householder Income Ages 45 - 64 years
Demographics Similar to Puerto Ricans by Householder Income Ages 45 - 64 years
In terms of householder income ages 45 - 64 years, the demographic groups most similar to Puerto Ricans are Navajo ($69,759, a difference of 0.76%), Houma ($72,093, a difference of 4.1%), Pima ($73,365, a difference of 6.0%), Lumbee ($65,113, a difference of 6.3%), and Tohono O'odham ($73,774, a difference of 6.6%).
| Demographics | Rating | Rank | Householder Income Ages 45 - 64 years |
| Immigrants | Congo | 0.0 /100 | #333 | Tragic $77,850 |
| Menominee | 0.0 /100 | #334 | Tragic $76,903 |
| Cheyenne | 0.0 /100 | #335 | Tragic $76,362 |
| Arapaho | 0.0 /100 | #336 | Tragic $75,945 |
| Pueblo | 0.0 /100 | #337 | Tragic $75,601 |
| Hopi | 0.0 /100 | #338 | Tragic $75,562 |
| Kiowa | 0.0 /100 | #339 | Tragic $74,815 |
| Immigrants | Yemen | 0.0 /100 | #340 | Tragic $74,575 |
| Crow | 0.0 /100 | #341 | Tragic $74,257 |
| Tohono O'odham | 0.0 /100 | #342 | Tragic $73,774 |
| Pima | 0.0 /100 | #343 | Tragic $73,365 |
| Houma | 0.0 /100 | #344 | Tragic $72,093 |
| Navajo | 0.0 /100 | #345 | Tragic $69,759 |
| Puerto Ricans | 0.0 /100 | #346 | Tragic $69,234 |
| Lumbee | 0.0 /100 | #347 | Tragic $65,113 |
Demographics Similar to Immigrants from Austria by Householder Income Ages 45 - 64 years
In terms of householder income ages 45 - 64 years, the demographic groups most similar to Immigrants from Austria are Immigrants from Russia ($113,215, a difference of 0.070%), Immigrants from South Africa ($112,886, a difference of 0.22%), Immigrants from Malaysia ($112,796, a difference of 0.30%), Immigrants from Indonesia ($113,519, a difference of 0.34%), and Australian ($113,533, a difference of 0.35%).
| Demographics | Rating | Rank | Householder Income Ages 45 - 64 years |
| Israelis | 99.9 /100 | #43 | Exceptional $114,186 |
| Bulgarians | 99.9 /100 | #44 | Exceptional $113,883 |
| Immigrants | France | 99.9 /100 | #45 | Exceptional $113,680 |
| Immigrants | Greece | 99.9 /100 | #46 | Exceptional $113,548 |
| Australians | 99.9 /100 | #47 | Exceptional $113,533 |
| Immigrants | Indonesia | 99.9 /100 | #48 | Exceptional $113,519 |
| Immigrants | Russia | 99.8 /100 | #49 | Exceptional $113,215 |
| Immigrants | Austria | 99.8 /100 | #50 | Exceptional $113,140 |
| Immigrants | South Africa | 99.8 /100 | #51 | Exceptional $112,886 |
| Immigrants | Malaysia | 99.8 /100 | #52 | Exceptional $112,796 |
| Afghans | 99.8 /100 | #53 | Exceptional $112,676 |
| Greeks | 99.8 /100 | #54 | Exceptional $112,630 |
| Lithuanians | 99.8 /100 | #55 | Exceptional $112,484 |
| Egyptians | 99.7 /100 | #56 | Exceptional $112,256 |
| Immigrants | Scotland | 99.7 /100 | #57 | Exceptional $112,175 |