Osage vs Immigrants from Austria Householder Income Ages 45 - 64 years
COMPARE
Osage
Immigrants from Austria
Householder Income Ages 45 - 64 years
Householder Income Ages 45 - 64 years Comparison
Osage
Immigrants from Austria
$88,390
HOUSEHOLDER INCOME AGES 45 - 64 YEARS
0.3/ 100
METRIC RATING
264th/ 347
METRIC RANK
$113,140
HOUSEHOLDER INCOME AGES 45 - 64 YEARS
99.8/ 100
METRIC RATING
50th/ 347
METRIC RANK
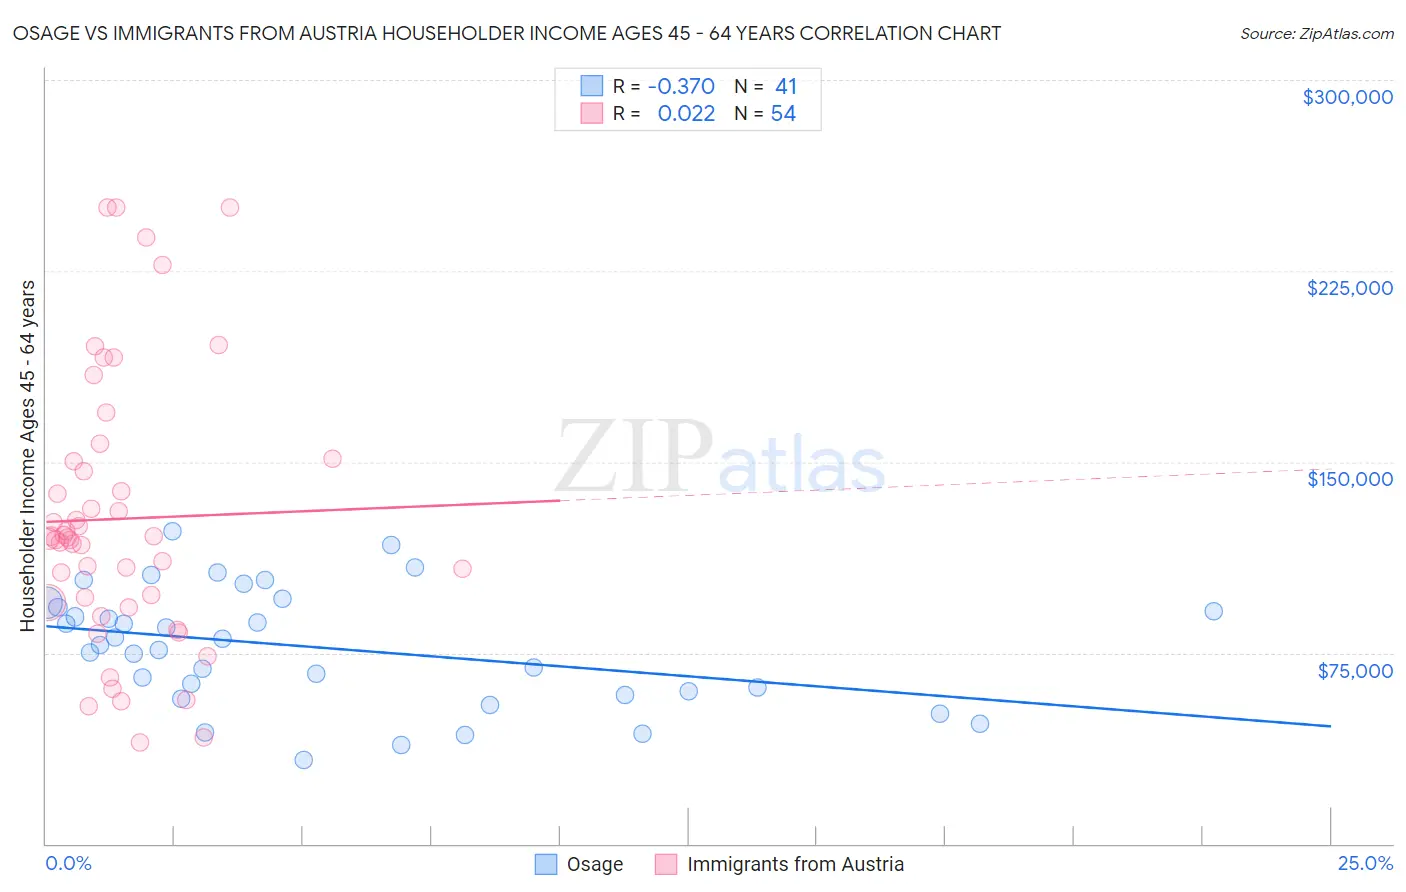
Osage vs Immigrants from Austria Householder Income Ages 45 - 64 years Correlation Chart
The statistical analysis conducted on geographies consisting of 91,774,888 people shows a mild negative correlation between the proportion of Osage and household income with householder between the ages 45 and 64 in the United States with a correlation coefficient (R) of -0.370 and weighted average of $88,390. Similarly, the statistical analysis conducted on geographies consisting of 167,924,064 people shows no correlation between the proportion of Immigrants from Austria and household income with householder between the ages 45 and 64 in the United States with a correlation coefficient (R) of 0.022 and weighted average of $113,140, a difference of 28.0%.
Householder Income Ages 45 - 64 years Correlation Summary
| Measurement | Osage | Immigrants from Austria |
| Minimum | $33,125 | $39,554 |
| Maximum | $122,824 | $250,001 |
| Range | $89,699 | $210,447 |
| Mean | $76,991 | $127,653 |
| Median | $78,120 | $120,029 |
| Interquartile 25% (IQ1) | $59,314 | $95,004 |
| Interquartile 75% (IQ3) | $93,781 | $150,192 |
| Interquartile Range (IQR) | $34,467 | $55,187 |
| Standard Deviation (Sample) | $22,918 | $52,842 |
| Standard Deviation (Population) | $22,637 | $52,351 |
Similar Demographics by Householder Income Ages 45 - 64 years
Demographics Similar to Osage by Householder Income Ages 45 - 64 years
In terms of householder income ages 45 - 64 years, the demographic groups most similar to Osage are Immigrants from Senegal ($88,421, a difference of 0.040%), Jamaican ($88,327, a difference of 0.070%), Somali ($88,600, a difference of 0.24%), Immigrants from West Indies ($88,164, a difference of 0.26%), and Hmong ($88,115, a difference of 0.31%).
| Demographics | Rating | Rank | Householder Income Ages 45 - 64 years |
| German Russians | 0.4 /100 | #257 | Tragic $89,398 |
| Immigrants | Barbados | 0.4 /100 | #258 | Tragic $89,394 |
| Immigrants | Nicaragua | 0.4 /100 | #259 | Tragic $89,108 |
| Liberians | 0.3 /100 | #260 | Tragic $88,929 |
| Belizeans | 0.3 /100 | #261 | Tragic $88,684 |
| Somalis | 0.3 /100 | #262 | Tragic $88,600 |
| Immigrants | Senegal | 0.3 /100 | #263 | Tragic $88,421 |
| Osage | 0.3 /100 | #264 | Tragic $88,390 |
| Jamaicans | 0.2 /100 | #265 | Tragic $88,327 |
| Immigrants | West Indies | 0.2 /100 | #266 | Tragic $88,164 |
| Hmong | 0.2 /100 | #267 | Tragic $88,115 |
| Immigrants | Micronesia | 0.2 /100 | #268 | Tragic $87,864 |
| Spanish Americans | 0.2 /100 | #269 | Tragic $87,836 |
| Immigrants | Liberia | 0.2 /100 | #270 | Tragic $87,739 |
| Guatemalans | 0.2 /100 | #271 | Tragic $87,705 |
Demographics Similar to Immigrants from Austria by Householder Income Ages 45 - 64 years
In terms of householder income ages 45 - 64 years, the demographic groups most similar to Immigrants from Austria are Immigrants from Russia ($113,215, a difference of 0.070%), Immigrants from South Africa ($112,886, a difference of 0.22%), Immigrants from Malaysia ($112,796, a difference of 0.30%), Immigrants from Indonesia ($113,519, a difference of 0.34%), and Australian ($113,533, a difference of 0.35%).
| Demographics | Rating | Rank | Householder Income Ages 45 - 64 years |
| Israelis | 99.9 /100 | #43 | Exceptional $114,186 |
| Bulgarians | 99.9 /100 | #44 | Exceptional $113,883 |
| Immigrants | France | 99.9 /100 | #45 | Exceptional $113,680 |
| Immigrants | Greece | 99.9 /100 | #46 | Exceptional $113,548 |
| Australians | 99.9 /100 | #47 | Exceptional $113,533 |
| Immigrants | Indonesia | 99.9 /100 | #48 | Exceptional $113,519 |
| Immigrants | Russia | 99.8 /100 | #49 | Exceptional $113,215 |
| Immigrants | Austria | 99.8 /100 | #50 | Exceptional $113,140 |
| Immigrants | South Africa | 99.8 /100 | #51 | Exceptional $112,886 |
| Immigrants | Malaysia | 99.8 /100 | #52 | Exceptional $112,796 |
| Afghans | 99.8 /100 | #53 | Exceptional $112,676 |
| Greeks | 99.8 /100 | #54 | Exceptional $112,630 |
| Lithuanians | 99.8 /100 | #55 | Exceptional $112,484 |
| Egyptians | 99.7 /100 | #56 | Exceptional $112,256 |
| Immigrants | Scotland | 99.7 /100 | #57 | Exceptional $112,175 |