Immigrants from Micronesia vs European Per Capita Income
COMPARE
Immigrants from Micronesia
European
Per Capita Income
Per Capita Income Comparison
Immigrants from Micronesia
Europeans
$37,464
PER CAPITA INCOME
0.1/ 100
METRIC RATING
292nd/ 347
METRIC RANK
$45,836
PER CAPITA INCOME
92.0/ 100
METRIC RATING
124th/ 347
METRIC RANK
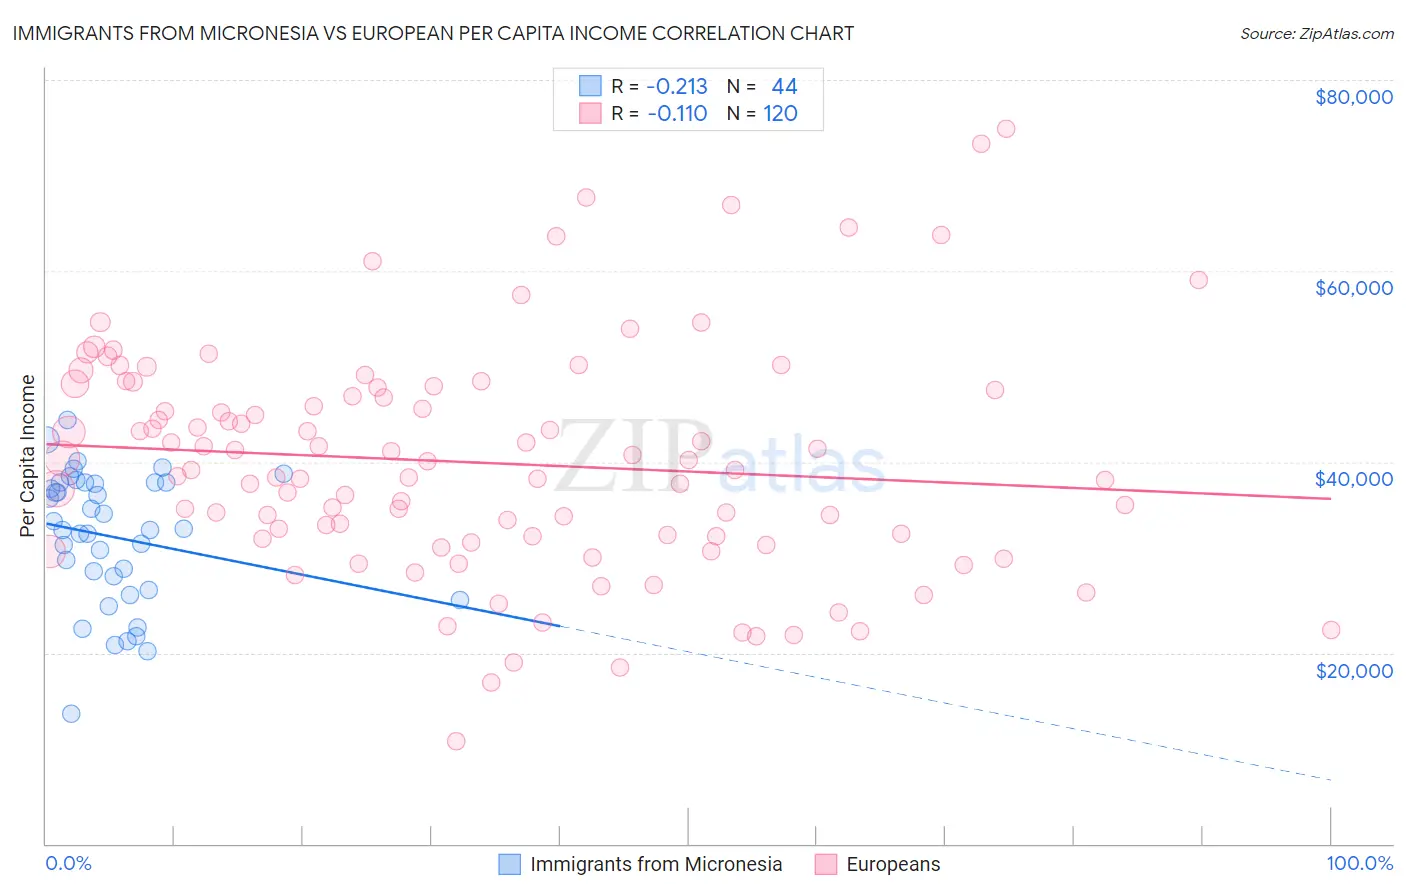
Immigrants from Micronesia vs European Per Capita Income Correlation Chart
The statistical analysis conducted on geographies consisting of 61,609,499 people shows a weak negative correlation between the proportion of Immigrants from Micronesia and per capita income in the United States with a correlation coefficient (R) of -0.213 and weighted average of $37,464. Similarly, the statistical analysis conducted on geographies consisting of 561,881,498 people shows a poor negative correlation between the proportion of Europeans and per capita income in the United States with a correlation coefficient (R) of -0.110 and weighted average of $45,836, a difference of 22.4%.
Per Capita Income Correlation Summary
| Measurement | Immigrants from Micronesia | European |
| Minimum | $13,631 | $10,710 |
| Maximum | $44,421 | $74,913 |
| Range | $30,790 | $64,203 |
| Mean | $32,171 | $39,928 |
| Median | $32,971 | $39,188 |
| Interquartile 25% (IQ1) | $27,332 | $32,091 |
| Interquartile 75% (IQ3) | $37,862 | $47,667 |
| Interquartile Range (IQR) | $10,531 | $15,576 |
| Standard Deviation (Sample) | $6,923 | $11,966 |
| Standard Deviation (Population) | $6,844 | $11,916 |
Similar Demographics by Per Capita Income
Demographics Similar to Immigrants from Micronesia by Per Capita Income
In terms of per capita income, the demographic groups most similar to Immigrants from Micronesia are Mexican American Indian ($37,407, a difference of 0.15%), Cajun ($37,527, a difference of 0.17%), Cuban ($37,383, a difference of 0.22%), Immigrants from Guatemala ($37,550, a difference of 0.23%), and U.S. Virgin Islander ($37,589, a difference of 0.33%).
| Demographics | Rating | Rank | Per Capita Income |
| Guatemalans | 0.1 /100 | #285 | Tragic $37,766 |
| Central American Indians | 0.1 /100 | #286 | Tragic $37,699 |
| Dominicans | 0.1 /100 | #287 | Tragic $37,697 |
| Blackfeet | 0.1 /100 | #288 | Tragic $37,695 |
| U.S. Virgin Islanders | 0.1 /100 | #289 | Tragic $37,589 |
| Immigrants | Guatemala | 0.1 /100 | #290 | Tragic $37,550 |
| Cajuns | 0.1 /100 | #291 | Tragic $37,527 |
| Immigrants | Micronesia | 0.1 /100 | #292 | Tragic $37,464 |
| Mexican American Indians | 0.1 /100 | #293 | Tragic $37,407 |
| Cubans | 0.1 /100 | #294 | Tragic $37,383 |
| Immigrants | Dominican Republic | 0.1 /100 | #295 | Tragic $37,306 |
| Indonesians | 0.1 /100 | #296 | Tragic $37,300 |
| Haitians | 0.1 /100 | #297 | Tragic $37,289 |
| Immigrants | Caribbean | 0.1 /100 | #298 | Tragic $37,254 |
| Cherokee | 0.1 /100 | #299 | Tragic $37,203 |
Demographics Similar to Europeans by Per Capita Income
In terms of per capita income, the demographic groups most similar to Europeans are Lebanese ($45,840, a difference of 0.010%), Moroccan ($45,854, a difference of 0.040%), Canadian ($45,858, a difference of 0.050%), Zimbabwean ($45,804, a difference of 0.070%), and Palestinian ($45,790, a difference of 0.10%).
| Demographics | Rating | Rank | Per Capita Income |
| Chinese | 93.9 /100 | #117 | Exceptional $46,098 |
| Immigrants | Saudi Arabia | 93.3 /100 | #118 | Exceptional $46,008 |
| Immigrants | Poland | 93.1 /100 | #119 | Exceptional $45,979 |
| Immigrants | Ethiopia | 92.7 /100 | #120 | Exceptional $45,923 |
| Canadians | 92.2 /100 | #121 | Exceptional $45,858 |
| Moroccans | 92.1 /100 | #122 | Exceptional $45,854 |
| Lebanese | 92.0 /100 | #123 | Exceptional $45,840 |
| Europeans | 92.0 /100 | #124 | Exceptional $45,836 |
| Zimbabweans | 91.7 /100 | #125 | Exceptional $45,804 |
| Palestinians | 91.6 /100 | #126 | Exceptional $45,790 |
| Immigrants | Germany | 91.3 /100 | #127 | Exceptional $45,751 |
| Swedes | 91.3 /100 | #128 | Exceptional $45,750 |
| Luxembourgers | 90.4 /100 | #129 | Exceptional $45,663 |
| Arabs | 90.4 /100 | #130 | Exceptional $45,662 |
| Immigrants | North Macedonia | 90.0 /100 | #131 | Exceptional $45,622 |