French American Indian vs Immigrants from Cambodia Median Male Earnings
COMPARE
French American Indian
Immigrants from Cambodia
Median Male Earnings
Median Male Earnings Comparison
French American Indians
Immigrants from Cambodia
$50,611
MEDIAN MALE EARNINGS
2.2/ 100
METRIC RATING
243rd/ 347
METRIC RANK
$51,594
MEDIAN MALE EARNINGS
5.5/ 100
METRIC RATING
224th/ 347
METRIC RANK
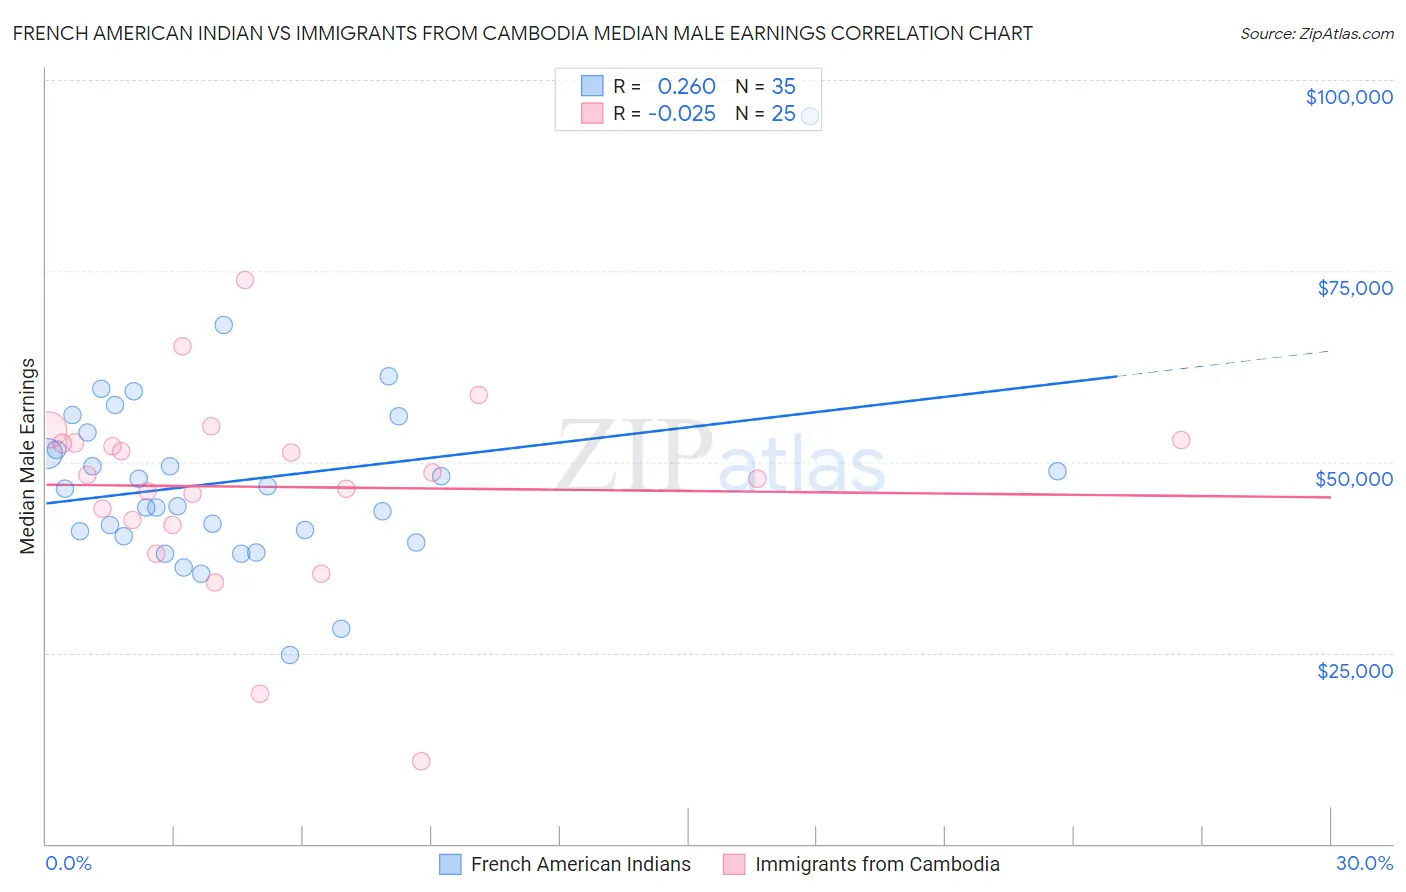
French American Indian vs Immigrants from Cambodia Median Male Earnings Correlation Chart
The statistical analysis conducted on geographies consisting of 131,955,005 people shows a weak positive correlation between the proportion of French American Indians and median male earnings in the United States with a correlation coefficient (R) of 0.260 and weighted average of $50,611. Similarly, the statistical analysis conducted on geographies consisting of 205,144,142 people shows no correlation between the proportion of Immigrants from Cambodia and median male earnings in the United States with a correlation coefficient (R) of -0.025 and weighted average of $51,594, a difference of 1.9%.
Median Male Earnings Correlation Summary
| Measurement | French American Indian | Immigrants from Cambodia |
| Minimum | $24,718 | $10,761 |
| Maximum | $95,250 | $73,759 |
| Range | $70,532 | $62,998 |
| Mean | $47,583 | $46,720 |
| Median | $46,502 | $48,267 |
| Interquartile 25% (IQ1) | $40,215 | $42,101 |
| Interquartile 75% (IQ3) | $53,921 | $52,654 |
| Interquartile Range (IQR) | $13,706 | $10,554 |
| Standard Deviation (Sample) | $12,435 | $12,824 |
| Standard Deviation (Population) | $12,256 | $12,565 |
Demographics Similar to French American Indians and Immigrants from Cambodia by Median Male Earnings
In terms of median male earnings, the demographic groups most similar to French American Indians are Guyanese ($50,613, a difference of 0.0%), Immigrants from St. Vincent and the Grenadines ($50,665, a difference of 0.11%), West Indian ($50,682, a difference of 0.14%), American ($50,761, a difference of 0.30%), and Malaysian ($50,772, a difference of 0.32%). Similarly, the demographic groups most similar to Immigrants from Cambodia are Ecuadorian ($51,596, a difference of 0.0%), Immigrants from Sudan ($51,489, a difference of 0.20%), Japanese ($51,473, a difference of 0.23%), Trinidadian and Tobagonian ($51,446, a difference of 0.29%), and Samoan ($51,389, a difference of 0.40%).
| Demographics | Rating | Rank | Median Male Earnings |
| Ecuadorians | 5.5 /100 | #223 | Tragic $51,596 |
| Immigrants | Cambodia | 5.5 /100 | #224 | Tragic $51,594 |
| Immigrants | Sudan | 5.0 /100 | #225 | Tragic $51,489 |
| Japanese | 4.9 /100 | #226 | Tragic $51,473 |
| Trinidadians and Tobagonians | 4.8 /100 | #227 | Tragic $51,446 |
| Samoans | 4.6 /100 | #228 | Tragic $51,389 |
| Immigrants | Trinidad and Tobago | 4.5 /100 | #229 | Tragic $51,376 |
| Immigrants | Nigeria | 4.2 /100 | #230 | Tragic $51,310 |
| Barbadians | 3.9 /100 | #231 | Tragic $51,236 |
| Sudanese | 3.9 /100 | #232 | Tragic $51,216 |
| Aleuts | 3.7 /100 | #233 | Tragic $51,168 |
| Cape Verdeans | 3.5 /100 | #234 | Tragic $51,103 |
| Immigrants | Western Africa | 3.0 /100 | #235 | Tragic $50,940 |
| Pennsylvania Germans | 2.8 /100 | #236 | Tragic $50,878 |
| Immigrants | Barbados | 2.6 /100 | #237 | Tragic $50,795 |
| Malaysians | 2.5 /100 | #238 | Tragic $50,772 |
| Americans | 2.5 /100 | #239 | Tragic $50,761 |
| West Indians | 2.3 /100 | #240 | Tragic $50,682 |
| Immigrants | St. Vincent and the Grenadines | 2.3 /100 | #241 | Tragic $50,665 |
| Guyanese | 2.2 /100 | #242 | Tragic $50,613 |
| French American Indians | 2.2 /100 | #243 | Tragic $50,611 |